
Page 177 - Defrosting for Air Source Heat Pump
P. 177
Frosting evenness coefficient 171
2.8
Case 1 Case 2 Case 3
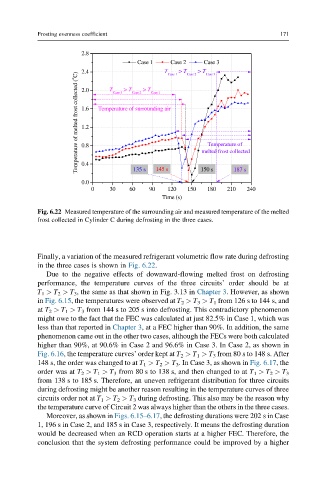
2.4 T Case 3 > T Case 2 > T Case 1 T Case 1 > T Case 2 > T Case 3
Temperature of melted frost collected ( o C) 1.6 Temperature of surrounding air melted frost collected
2.0
1.2
Temperature of
0.8
0.4
0.0 135 s 145 s 150 s 187 s
0 30 60 90 120 150 180 210 240
Time (s)
Fig. 6.22 Measured temperature of the surrounding air and measured temperature of the melted
frost collected in Cylinder C during defrosting in the three cases.
Finally, a variation of the measured refrigerant volumetric flow rate during defrosting
in the three cases is shown in Fig. 6.22.
Due to the negative effects of downward-flowing melted frost on defrosting
performance, the temperature curves of the three circuits’ order should be at
T 1 > T 2 > T 3 , the same as that shown in Fig. 3.13 in Chapter 3. However, as shown
in Fig. 6.15, the temperatures were observed at T 2 > T 3 > T 1 from 126 s to 144 s, and
at T 2 > T 1 > T 3 from 144 s to 205 s into defrosting. This contradictory phenomenon
might owe to the fact that the FEC was calculated at just 82.5% in Case 1, which was
less than that reported in Chapter 3, at a FEC higher than 90%. In addition, the same
phenomenon came out in the other two cases, although the FECs were both calculated
higher than 90%, at 90.6% in Case 2 and 96.6% in Case 3. In Case 2, as shown in
Fig. 6.16, the temperature curves’ order kept at T 2 > T 1 > T 3 from 80 s to 148 s. After
148 s, the order was changed to at T 1 > T 2 > T 3 . In Case 3, as shown in Fig. 6.17, the
order was at T 2 > T 1 > T 3 from 80 s to 138 s, and then changed to at T 1 > T 2 > T 3
from 138 s to 185 s. Therefore, an uneven refrigerant distribution for three circuits
during defrosting might be another reason resulting in the temperature curves of three
circuits order not at T 1 > T 2 > T 3 during defrosting. This also may be the reason why
the temperature curve of Circuit 2 was always higher than the others in the three cases.
Moreover, as shown in Figs. 6.15–6.17, the defrosting durations were 202 s in Case
1, 196 s in Case 2, and 185 s in Case 3, respectively. It means the defrosting duration
would be decreased when an RCD operation starts at a higher FEC. Therefore, the
conclusion that the system defrosting performance could be improved by a higher