
Page 184 - Defrosting for Air Source Heat Pump
P. 184
178 Defrosting for Air Source Heat Pump
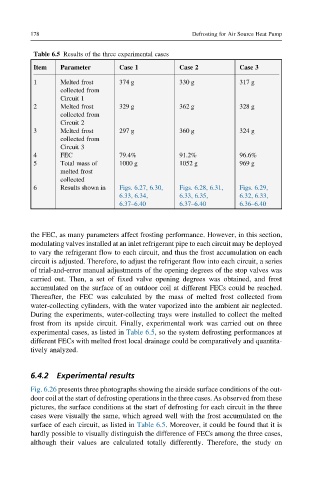
Table 6.5 Results of the three experimental cases
Item Parameter Case 1 Case 2 Case 3
1 Melted frost 374 g 330 g 317 g
collected from
Circuit 1
2 Melted frost 329 g 362 g 328 g
collected from
Circuit 2
3 Melted frost 297 g 360 g 324 g
collected from
Circuit 3
4 FEC 79.4% 91.2% 96.6%
5 Total mass of 1000 g 1052 g 969 g
melted frost
collected
6 Results shown in Figs. 6.27, 6.30, Figs. 6.28, 6.31, Figs. 6.29,
6.33, 6.34, 6.33, 6.35, 6.32, 6.33,
6.37–6.40 6.37–6.40 6.36–6.40
the FEC, as many parameters affect frosting performance. However, in this section,
modulating valves installed at an inlet refrigerant pipe to each circuit may be deployed
to vary the refrigerant flow to each circuit, and thus the frost accumulation on each
circuit is adjusted. Therefore, to adjust the refrigerant flow into each circuit, a series
of trial-and-error manual adjustments of the opening degrees of the stop valves was
carried out. Then, a set of fixed valve opening degrees was obtained, and frost
accumulated on the surface of an outdoor coil at different FECs could be reached.
Thereafter, the FEC was calculated by the mass of melted frost collected from
water-collecting cylinders, with the water vaporized into the ambient air neglected.
During the experiments, water-collecting trays were installed to collect the melted
frost from its upside circuit. Finally, experimental work was carried out on three
experimental cases, as listed in Table 6.5, so the system defrosting performances at
different FECs with melted frost local drainage could be comparatively and quantita-
tively analyzed.
6.4.2 Experimental results
Fig. 6.26 presents three photographs showing the airside surface conditions of the out-
door coil at the start of defrosting operations in the three cases. As observed from these
pictures, the surface conditions at the start of defrosting for each circuit in the three
cases were visually the same, which agreed well with the frost accumulated on the
surface of each circuit, as listed in Table 6.5. Moreover, it could be found that it is
hardly possible to visually distinguish the difference of FECs among the three cases,
although their values are calculated totally differently. Therefore, the study on