
Page 185 - Defrosting for Air Source Heat Pump
P. 185
Frosting evenness coefficient 179
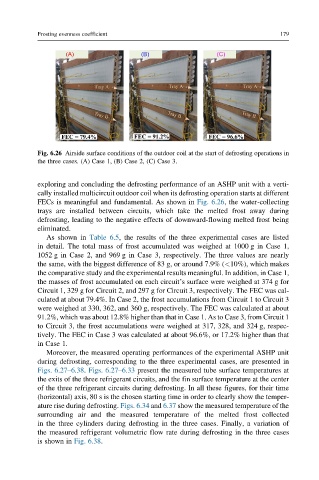
Fig. 6.26 Airside surface conditions of the outdoor coil at the start of defrosting operations in
the three cases. (A) Case 1, (B) Case 2, (C) Case 3.
exploring and concluding the defrosting performance of an ASHP unit with a verti-
cally installed multicircuit outdoor coil when its defrosting operation starts at different
FECs is meaningful and fundamental. As shown in Fig. 6.26, the water-collecting
trays are installed between circuits, which take the melted frost away during
defrosting, leading to the negative effects of downward-flowing melted frost being
eliminated.
As shown in Table 6.5, the results of the three experimental cases are listed
in detail. The total mass of frost accumulated was weighed at 1000 g in Case 1,
1052 g in Case 2, and 969 g in Case 3, respectively. The three values are nearly
the same, with the biggest difference of 83 g, or around 7.9% (<10%), which makes
the comparative study and the experimental results meaningful. In addition, in Case 1,
the masses of frost accumulated on each circuit’s surface were weighed at 374 g for
Circuit 1, 329 g for Circuit 2, and 297 g for Circuit 3, respectively. The FEC was cal-
culated at about 79.4%. In Case 2, the frost accumulations from Circuit 1 to Circuit 3
were weighed at 330, 362, and 360 g, respectively. The FEC was calculated at about
91.2%, which was about 12.8% higher than that in Case 1. As to Case 3, from Circuit 1
to Circuit 3, the frost accumulations were weighed at 317, 328, and 324 g, respec-
tively. The FEC in Case 3 was calculated at about 96.6%, or 17.2% higher than that
in Case 1.
Moreover, the measured operating performances of the experimental ASHP unit
during defrosting, corresponding to the three experimental cases, are presented in
Figs. 6.27–6.38. Figs. 6.27–6.33 present the measured tube surface temperatures at
the exits of the three refrigerant circuits, and the fin surface temperature at the center
of the three refrigerant circuits during defrosting. In all these figures, for their time
(horizontal) axis, 80 s is the chosen starting time in order to clearly show the temper-
ature rise during defrosting. Figs. 6.34 and 6.37 show the measured temperature of the
surrounding air and the measured temperature of the melted frost collected
in the three cylinders during defrosting in the three cases. Finally, a variation of
the measured refrigerant volumetric flow rate during defrosting in the three cases
is shown in Fig. 6.38.