Page 191 - Defrosting for Air Source Heat Pump
P. 191

Frosting evenness coefficient                                     185


                       1.8
                                        Case 1     Case 2     Case 3
                       1.5
                            Temperature of surrounding air  Temperature of melted
                                                      frost collected
                       1.2
                     Temperature ( o C)  0.9


                       0.6
                                           157 s
                       0.3
                                           141 s
                       0.0
                                           135 s
                      –0.3
                         0    30    60   90    120  150   180  210   240
                                             Time (s)
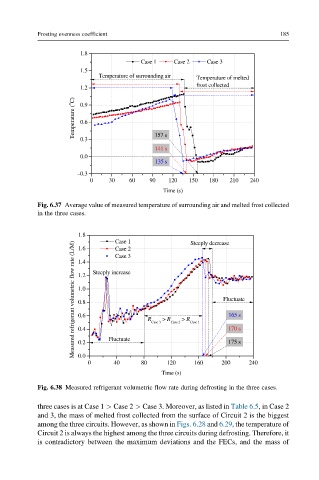
           Fig. 6.37 Average value of measured temperature of surrounding air and melted frost collected
           in the three cases.

                      1.8        Case 1              Steeply decrease
                     Measured refrigerant volumetric flow rate (L/M)  1.2  Steeply increase  R  Case 3  > R Case 2  > R Case 1  Fluctuate
                      1.6
                                 Case 2
                                 Case 3
                      1.4

                      1.0

                      0.8
                                                               165 s
                      0.6
                                                               170 s
                      0.4
                      0.2

                      0.0
                         0    Fluctuate  80   120     160    200 175 s  240
                                40
                                             Time (s)
           Fig. 6.38 Measured refrigerant volumetric flow rate during defrosting in the three cases.

           three cases is at Case 1 > Case 2 > Case 3. Moreover, as listed in Table 6.5, in Case 2
           and 3, the mass of melted frost collected from the surface of Circuit 2 is the biggest
           among the three circuits. However, as shown in Figs. 6.28 and 6.29, the temperature of
           Circuit 2 is always the highest among the three circuits during defrosting. Therefore, it
           is contradictory between the maximum deviations and the FECs, and the mass of
   186   187   188   189   190   191   192   193   194   195   196