
Page 194 - Defrosting for Air Source Heat Pump
P. 194
188 Defrosting for Air Source Heat Pump
surrounding air temperature. This also demonstrated that the melted frost temperature
is mainly affected by the later melted frost flowing into the cylinder.
Fig. 6.38 presents the measured refrigerant volumetric flow rate during defrosting
in the three cases. It is observed that the measured refrigerant volumetric flow rate
keeps fluctuating severely from 0 to 80 s, especially during the first 40 s into
defrosting. This is because the compressor discharge pressure increased suddenly
at the start of an RCD operation, and the internal diameter of the EEV is very small.
In addition, a lot of energy is consumed during defrosting at the frost-melting stage
described in Chapter 4, with a lot of refrigerant changing phases from the gas state
to the two-phase state. Therefore, the measured refrigerant volumetric flow rate fluc-
tuates with severe pressure changes. When the defrosting process came into the water
layer vaporizing stage described in Chapter 4, the pressures of the compressor suction
and discharge both increase, leading to the refrigerant volumetric flow rate changing
from increasing to decreasing. As shown in Fig. 6.38, from 80 to 165 s into defrosting,
the order of the measured refrigerant volumetric flow rate during defrosting in the
three cases is R Case 3 > R Case 2 > R Case 1 . This results because the defrosting perfor-
mance in Case 3 is better than in Case 1, which makes the refrigerant flow rate increase
earlier. Finally, from Case 1 to Case 3, their peak values came out at 175, 170, and
165 s, respectively. Here, it is further confirmed that the defrosting performance
would be improved with a higher FEC as a defrosting start for an ASHP unit with
a vertically installed multicircuit outdoor coil.
6.4.3 Durations, energy analysis, and discussions
Table 6.6 lists the durations for tubes and fins and their DECs in the three cases.
It could be found that the DEC for tube surface temperature is 97.97% for Case 1,
97.86% for Case 2, and 98.26% for Case 3, respectively. The DEC for fin surface tem-
perature is 97.58% for Case 1, 97.01% for Case 2, and 97.83% for Case 3, respec-
tively. Obviously, the DEC orders of tube and fin surface temperature in the three
cases are the same, at DEC 3 > DEC 2 > DEC 1 . But the order is different from that
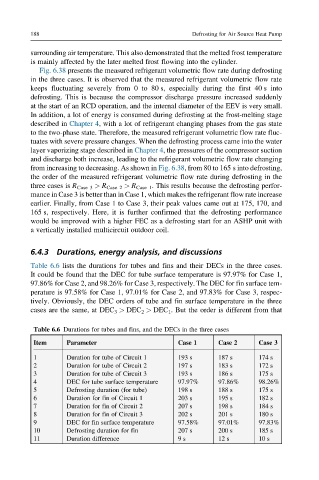
Table 6.6 Durations for tubes and fins, and the DECs in the three cases
Item Parameter Case 1 Case 2 Case 3
1 Duration for tube of Circuit 1 193 s 187 s 174 s
2 Duration for tube of Circuit 2 197 s 183 s 172 s
3 Duration for tube of Circuit 3 193 s 186 s 175 s
4 DEC for tube surface temperature 97.97% 97.86% 98.26%
5 Defrosting duration (for tube) 198 s 188 s 175 s
6 Duration for fin of Circuit 1 203 s 195 s 182 s
7 Duration for fin of Circuit 2 207 s 198 s 184 s
8 Duration for fin of Circuit 3 202 s 201 s 180 s
9 DEC for fin surface temperature 97.58% 97.01% 97.83%
10 Defrosting duration for fin 207 s 200 s 185 s
11 Duration difference 9 s 12 s 10 s