
Page 195 - Defrosting for Air Source Heat Pump
P. 195
Frosting evenness coefficient 189
of their FECs. In addition, the duration differences between the fin surface tempera-
ture and the tube surface temperature are nearly the same, at 9 s for Case 1, 12 s for
Case 2, and 10 s for Case 3, respectively.
The energy used for the RCD comes from three sources: the power input to the
compressor, the power input to the indoor air fan, and the thermal energy from indoor
air. As shown in Table 6.7 and Fig. 6.39, the energy supplies for defrosting in the three
cases were calculated, with the calculated relative standard errors listed in Table 3.3.2
in Chapter 3. In this experimental study, the total energy used for defrosting was cal-
culated at 781.8 kJ in Case 1, 753.2 kJ in Case 2, or 3.7% less, and 678.8 kJ in Case 3,
or 13.2% less than that in Case 1, respectively. The main difference came from the
thermal energy from the indoor air, with a difference of 92.3 kJ between Case 1
and Case 3. However, the ratio of this part of the energy was kept at around
83%–85%, without obvious changes with the energy supply decreasing.
Defrosting efficiency can be used to evaluate the performance of a defrosting oper-
ation. It is defined as the ratio of the actual amount of energy consumption required to
both melt the accumulated frost and vaporize the retained melted frost to the total
amount of energy available from an outdoor coil during an entire defrosting operation.
In this section, the defrosting efficiencies were calculated at 45.0% in Case 1, 48.4%
in Case 2, and 50.7% in Case 3, as shown in Table 6.7. The difference of defrosting
efficiency between Case 1 and Case 3 was 5.7%.
Moreover, Fig. 6.40 shows the defrosting durations and the durations of fin surface
temperatures all reaching 24°C, the refrigerant volumetric flow rate reaching its peak
value, and the temperature of the melted frost collected reaching its lowest value in the
three cases, respectively. It could be found that the differences between Case 1 and
Case 3 were 23 s for fin surface temperature all reaching 24°C, 22 s for defrosting
duration, 22 s for the temperature of the melted frost collected reaching its lowest
value, and 10 s for refrigerant volumetric flow rate reaching its peak value, from high
to low. All the previous five parameters could demonstrate that the defrosting perfor-
mance could be improved when an RCD operation starts at a higher FEC for an ASHP
unit with a multicircuit outdoor coil.
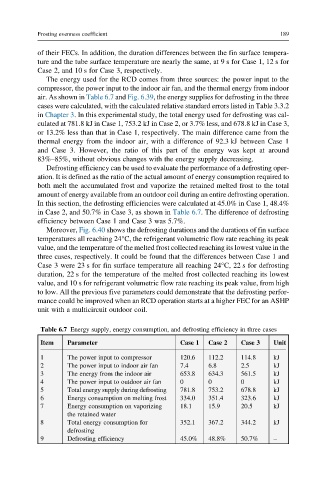
Table 6.7 Energy supply, energy consumption, and defrosting efficiency in three cases
Item Parameter Case 1 Case 2 Case 3 Unit
1 The power input to compressor 120.6 112.2 114.8 kJ
2 The power input to indoor air fan 7.4 6.8 2.5 kJ
3 The energy from the indoor air 653.8 634.3 561.5 kJ
4 The power input to outdoor air fan 0 0 0 kJ
5 Total energy supply during defrosting 781.8 753.2 678.8 kJ
6 Energy consumption on melting frost 334.0 351.4 323.6 kJ
7 Energy consumption on vaporizing 18.1 15.9 20.5 kJ
the retained water
8 Total energy consumption for 352.1 367.2 344.2 kJ
defrosting
9 Defrosting efficiency 45.0% 48.8% 50.7% –