
Page 302 - Defrosting for Air Source Heat Pump
P. 302
296 Defrosting for Air Source Heat Pump
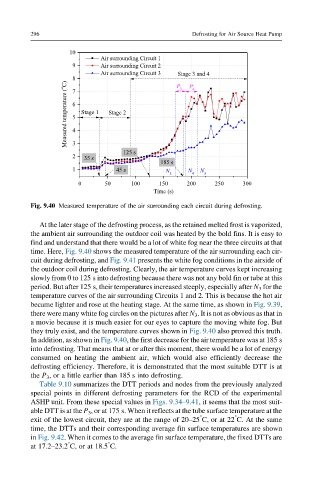
Fig. 9.40 Measured temperature of the air surrounding each circuit during defrosting.
At the later stage of the defrosting process, as the retained melted frost is vaporized,
the ambient air surrounding the outdoor coil was heated by the bold fins. It is easy to
find and understand that there would be a lot of white fog near the three circuits at that
time. Here, Fig. 9.40 shows the measured temperature of the air surrounding each cir-
cuit during defrosting, and Fig. 9.41 presents the white fog conditions in the airside of
the outdoor coil during defrosting. Clearly, the air temperature curves kept increasing
slowly from 0 to 125 s into defrosting because there was not any bold fin or tube at this
period. But after 125 s, their temperatures increased steeply, especially after N 3 for the
temperature curves of the air surrounding Circuits 1 and 2. This is because the hot air
became lighter and rose at the heating stage. At the same time, as shown in Fig. 9.39,
there were many white fog circles on the pictures after N 3 . It is not as obvious as that in
a movie because it is much easier for our eyes to capture the moving white fog. But
they truly exist, and the temperature curves shown in Fig. 9.40 also proved this truth.
In addition, as shown in Fig. 9.40, the first decrease for the air temperature was at 185 s
into defrosting. That means that at or after this moment, there would be a lot of energy
consumed on heating the ambient air, which would also efficiently decrease the
defrosting efficiency. Therefore, it is demonstrated that the most suitable DTT is at
the P 3 , or a little earlier than 185 s into defrosting.
Table 9.10 summarizes the DTT periods and nodes from the previously analyzed
special points in different defrosting parameters for the RCD of the experimental
ASHP unit. From these special values in Figs. 9.34–9.41, it seems that the most suit-
able DTT is at the P 3 , or at 175 s. When it reflects at the tube surface temperature at the
° °
exit of the lowest circuit, they are at the range of 20–25 C, or at 22 C. At the same
time, the DTTs and their corresponding average fin surface temperatures are shown
in Fig. 9.42. When it comes to the average fin surface temperature, the fixed DTTs are
° °
at 17.2–23.2 C, or at 18.5 C.