
Page 297 - Defrosting for Air Source Heat Pump
P. 297
Defrosting control strategy 291
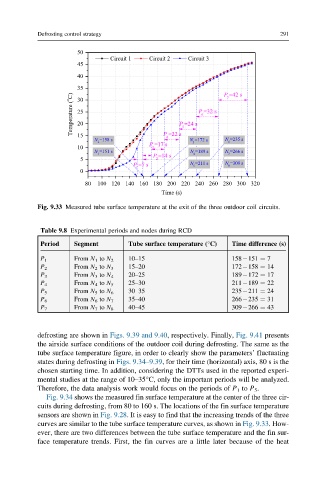
Fig. 9.33 Measured tube surface temperature at the exit of the three outdoor coil circuits.
Table 9.8 Experimental periods and nodes during RCD
Period Segment Tube surface temperature (°C) Time difference (s)
P 1 From N 1 to N 2 10–15 158 151 ¼ 7
P 2 From N 2 to N 3 15–20 172 158 ¼ 14
P 3 From N 3 to N 4 20–25 189 172 ¼ 17
P 4 From N 4 to N 5 25–30 211 189 ¼ 22
P 5 From N 5 to N 6 30–35 235 211 ¼ 24
P 6 From N 6 to N 7 35–40 266 235 ¼ 31
P 7 From N 7 to N 8 40–45 309 266 ¼ 43
defrosting are shown in Figs. 9.39 and 9.40, respectively. Finally, Fig. 9.41 presents
the airside surface conditions of the outdoor coil during defrosting. The same as the
tube surface temperature figure, in order to clearly show the parameters’ fluctuating
states during defrosting in Figs. 9.34–9.39, for their time (horizontal) axis, 80 s is the
chosen starting time. In addition, considering the DTTs used in the reported experi-
mental studies at the range of 10–35°C, only the important periods will be analyzed.
Therefore, the data analysis work would focus on the periods of P 1 to P 5 .
Fig. 9.34 shows the measured fin surface temperature at the center of the three cir-
cuits during defrosting, from 80 to 160 s. The locations of the fin surface temperature
sensors are shown in Fig. 9.28. It is easy to find that the increasing trends of the three
curves are similar to the tube surface temperature curves, as shown in Fig. 9.33. How-
ever, there are two differences between the tube surface temperature and the fin sur-
face temperature trends. First, the fin curves are a little later because of the heat