
Page 296 - Defrosting for Air Source Heat Pump
P. 296
290 Defrosting for Air Source Heat Pump
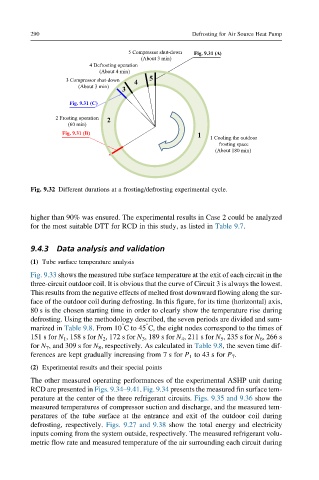
Fig. 9.32 Different durations at a frosting/defrosting experimental cycle.
higher than 90% was ensured. The experimental results in Case 2 could be analyzed
for the most suitable DTT for RCD in this study, as listed in Table 9.7.
9.4.3 Data analysis and validation
(1) Tube surface temperature analysis
Fig. 9.33 shows the measured tube surface temperature at the exit of each circuit in the
three-circuit outdoor coil. It is obvious that the curve of Circuit 3 is always the lowest.
This results from the negative effects of melted frost downward flowing along the sur-
face of the outdoor coil during defrosting. In this figure, for its time (horizontal) axis,
80 s is the chosen starting time in order to clearly show the temperature rise during
defrosting. Using the methodology described, the seven periods are divided and sum-
° °
marized in Table 9.8. From 10 Cto45 C, the eight nodes correspond to the times of
151 s for N 1 , 158 s for N 2 , 172 s for N 3 , 189 s for N 4 , 211 s for N 5 , 235 s for N 6 , 266 s
for N 7 , and 309 s for N 8 , respectively. As calculated in Table 9.8, the seven time dif-
ferences are kept gradually increasing from 7 s for P 1 to 43 s for P 7 .
(2) Experimental results and their special points
The other measured operating performances of the experimental ASHP unit during
RCD are presented in Figs. 9.34–9.41. Fig. 9.34 presents the measured fin surface tem-
perature at the center of the three refrigerant circuits. Figs. 9.35 and 9.36 show the
measured temperatures of compressor suction and discharge, and the measured tem-
peratures of the tube surface at the entrance and exit of the outdoor coil during
defrosting, respectively. Figs. 9.27 and 9.38 show the total energy and electricity
inputs coming from the system outside, respectively. The measured refrigerant volu-
metric flow rate and measured temperature of the air surrounding each circuit during