
Page 293 - Defrosting for Air Source Heat Pump
P. 293
Defrosting control strategy 287
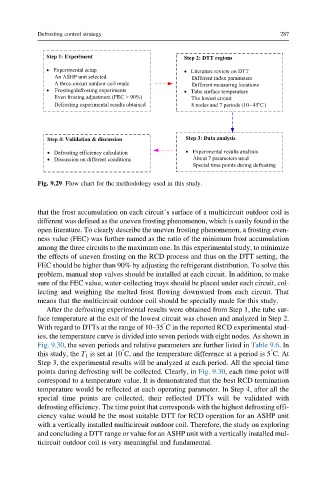
Fig. 9.29 Flow chart for the methodology used in this study.
that the frost accumulation on each circuit’s surface of a multicircuit outdoor coil is
different was defined as the uneven frosting phenomenon, which is easily found in the
open literature. To clearly describe the uneven frosting phenomenon, a frosting even-
ness value (FEC) was further named as the ratio of the minimum frost accumulation
among the three circuits to the maximum one. In this experimental study, to minimize
the effects of uneven frosting on the RCD process and thus on the DTT setting, the
FEC should be higher than 90% by adjusting the refrigerant distribution. To solve this
problem, manual stop valves should be installed at each circuit. In addition, to make
sure of the FEC value, water-collecting trays should be placed under each circuit, col-
lecting and weighing the melted frost flowing downward from each circuit. That
means that the multicircuit outdoor coil should be specially made for this study.
After the defrosting experimental results were obtained from Step 1, the tube sur-
face temperature at the exit of the lowest circuit was chosen and analyzed in Step 2.
°
With regard to DTTs at the range of 10–35 C in the reported RCD experimental stud-
ies, the temperature curve is divided into seven periods with eight nodes. As shown in
Fig. 9.30, the seven periods and relative parameters are further listed in Table 9.6.In
° °
this study, the T 1 is set at 10 C, and the temperature difference at a period is 5 C. At
Step 3, the experimental results will be analyzed at each period. All the special time
points during defrosting will be collected. Clearly, in Fig. 9.30, each time point will
correspond to a temperature value. It is demonstrated that the best RCD termination
temperature would be reflected at each operating parameter. In Step 4, after all the
special time points are collected, their reflected DTTs will be validated with
defrosting efficiency. The time point that corresponds with the highest defrosting effi-
ciency value would be the most suitable DTT for RCD operation for an ASHP unit
with a vertically installed multicircuit outdoor coil. Therefore, the study on exploring
and concluding a DTT range or value for an ASHP unit with a vertically installed mul-
ticircuit outdoor coil is very meaningful and fundamental.