
Page 295 - Defrosting for Air Source Heat Pump
P. 295
Defrosting control strategy 289
Table 9.7 Two frosting experimental cases
Item Parameters Case 1 Case 2
1 Circuit number 3 3
2 Frosting duration 60 min 60 min
3 Water-collecting trays With Without
4 FEC >90% (calculated) >90% (adjusted)
5 Purpose Adjusting FEC Analyzing DTT
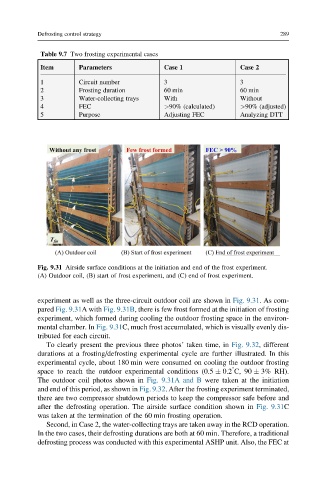
Fig. 9.31 Airside surface conditions at the initiation and end of the frost experiment.
(A) Outdoor coil, (B) start of frost experiment, and (C) end of frost experiment.
experiment as well as the three-circuit outdoor coil are shown in Fig. 9.31. As com-
pared Fig. 9.31Awith Fig. 9.31B, there is few frost formed at the initiation of frosting
experiment, which formed during cooling the outdoor frosting space in the environ-
mental chamber. In Fig. 9.31C, much frost accumulated, which is visually evenly dis-
tributed for each circuit.
To clearly present the previous three photos’ taken time, in Fig. 9.32, different
durations at a frosting/defrosting experimental cycle are further illustrated. In this
experimental cycle, about 180 min were consumed on cooling the outdoor frosting
°
space to reach the outdoor experimental conditions (0.5 0.2 C, 90 3% RH).
The outdoor coil photos shown in Fig. 9.31A and B were taken at the initiation
and end of this period, as shown in Fig. 9.32. After the frosting experiment terminated,
there are two compressor shutdown periods to keep the compressor safe before and
after the defrosting operation. The airside surface condition shown in Fig. 9.31C
was taken at the termination of the 60 min frosting operation.
Second, in Case 2, the water-collecting trays are taken away in the RCD operation.
In the two cases, their defrosting durations are both at 60 min. Therefore, a traditional
defrosting process was conducted with this experimental ASHP unit. Also, the FEC at