
Page 301 - Defrosting for Air Source Heat Pump
P. 301
Defrosting control strategy 295
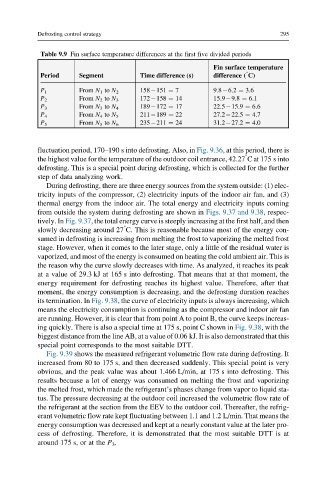
Table 9.9 Fin surface temperature differences at the first five divided periods
Fin surface temperature
°
Period Segment Time difference (s) difference ( C)
P 1 From N 1 to N 2 158 151 ¼ 7 9.8 6.2 ¼ 3.6
P 2 From N 2 to N 3 172 158 ¼ 14 15.9 9.8 ¼ 6.1
189 172 ¼ 17 22.5 15.9 ¼ 6.6
P 3 From N 3 to N 4
211 189 ¼ 22 27.2 22.5 ¼ 4.7
P 4 From N 4 to N 5
235 211 ¼ 24 31.2 27.2 ¼ 4.0
P 5 From N 5 to N 6
fluctuation period, 170–190 s into defrosting. Also, in Fig. 9.36, at this period, there is
°
the highest value for the temperature of the outdoor coil entrance, 42.27 C at 175 s into
defrosting. This is a special point during defrosting, which is collected for the further
step of data analyzing work.
During defrosting, there are three energy sources from the system outside: (1) elec-
tricity inputs of the compressor, (2) electricity inputs of the indoor air fan, and (3)
thermal energy from the indoor air. The total energy and electricity inputs coming
from outside the system during defrosting are shown in Figs. 9.37 and 9.38, respec-
tively. In Fig. 9.37, the total energy curve is steeply increasing at the first half, and then
°
slowly decreasing around 27 C. This is reasonable because most of the energy con-
sumed in defrosting is increasing from melting the frost to vaporizing the melted frost
stage. However, when it comes to the later stage, only a little of the residual water is
vaporized, and most of the energy is consumed on heating the cold ambient air. This is
the reason why the curve slowly decreases with time. As analyzed, it reaches its peak
at a value of 29.3 kJ at 165 s into defrosting. That means that at that moment, the
energy requirement for defrosting reaches its highest value. Therefore, after that
moment, the energy consumption is decreasing, and the defrosting duration reaches
its termination. In Fig. 9.38, the curve of electricity inputs is always increasing, which
means the electricity consumption is continuing as the compressor and indoor air fan
are running. However, it is clear that from point A to point B, the curve keeps increas-
ing quickly. There is also a special time at 175 s, point C shown in Fig. 9.38, with the
biggest distance from the line AB, at a value of 0.06 kJ. It is also demonstrated that this
special point corresponds to the most suitable DTT.
Fig. 9.39 shows the measured refrigerant volumetric flow rate during defrosting. It
increased from 80 to 175 s, and then decreased suddenly. This special point is very
obvious, and the peak value was about 1.466 L/min, at 175 s into defrosting. This
results because a lot of energy was consumed on melting the frost and vaporizing
the melted frost, which made the refrigerant’s phases change from vapor to liquid sta-
tus. The pressure decreasing at the outdoor coil increased the volumetric flow rate of
the refrigerant at the section from the EEV to the outdoor coil. Thereafter, the refrig-
erant volumetric flow rate kept fluctuating between 1.1 and 1.2 L/min. That means the
energy consumption was decreased and kept at a nearly constant value at the later pro-
cess of defrosting. Therefore, it is demonstrated that the most suitable DTT is at
around 175 s, or at the P 3 .