
Page 310 - Design and Operation of Heat Exchangers and their Networks
P. 310
296 Design and operation of heat exchangers and their networks
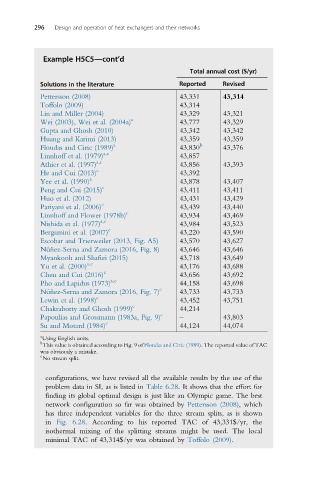
Example H5C5—cont’d
Total annual cost ($/yr)
Solutions in the literature Reported Revised
Pettersson (2008) 43,331 43,314
Toffolo (2009) 43,314
Lin and Miller (2004) 43,329 43,321
Wei (2003), Wei et al. (2004a) a 43,777 43,329
Gupta and Ghosh (2010) 43,342 43,342
Huang and Karimi (2013) 43,359 43,359
Floudas and Ciric (1989) a 43,830 b 43,376
Linnhoff et al. (1979) a,c 43,857
Athier et al. (1997) a,c 43,856 43,393
He and Cui (2013) c 43,392
Yee et al. (1990) a 43,878 43,407
Peng and Cui (2015) c 43,411 43,411
Huo et al. (2012) 43,431 43,429
c
Pariyani et al. (2006) 43,439 43,440
Linnhoff and Flower (1978b) c 43,934 43,469
a,c
Nishida et al. (1977) 43,984 43,523
Bergamini et al. (2007) c 43,220 43,590
Escobar and Trierweiler (2013, Fig. A5) 43,570 43,627
Nu ´n ˜ez-Serna and Zamora (2016, Fig. 8) 43,646 43,646
Myankooh and Shafiei (2015) 43,718 43,649
Yu et al. (2000) a,c 43,176 43,688
Chen and Cui (2016) c 43,656 43,692
Pho and Lapidus (1973) a,c 44,158 43,698
Nu ´n ˜ez-Serna and Zamora (2016, Fig. 7) c 43,733 43,733
c
Lewin et al. (1998) 43,452 43,751
Chakraborty and Ghosh (1999) c 44,214
c
Papoulias and Grossmann (1983a, Fig. 9) – 43,803
Su and Motard (1984) c 44,124 44,074
a
Using English units.
b
This value is obtained according to Fig. 9 of Floudas and Ciric (1989). The reported value of TAC
was obviously a mistake.
c
No stream split.
configurations, we have revised all the available results by the use of the
problem data in SI, as is listed in Table 6.28. It shows that the effort for
finding its global optimal design is just like an Olympic game. The best
network configuration so far was obtained by Pettersson (2008), which
has three independent variables for the three stream splits, as is shown
in Fig. 6.28. According to his reported TAC of 43,331$/yr, the
isothermal mixing of the splitting streams might be used. The local
minimal TAC of 43,314$/yr was obtained by Toffolo (2009).