
Page 314 - Design and Operation of Heat Exchangers and their Networks
P. 314
300 Design and operation of heat exchangers and their networks
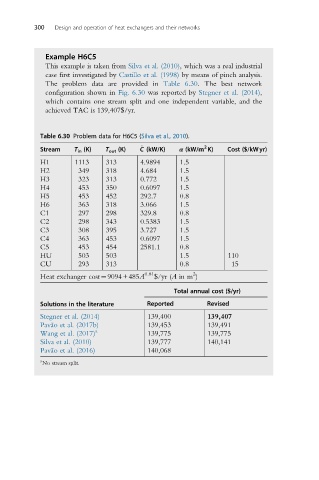
Example H6C5
This example is taken from Silva et al. (2010), which was a real industrial
case first investigated by Castillo et al. (1998) by means of pinch analysis.
The problem data are provided in Table 6.30. The best network
configuration shown in Fig. 6.30 was reported by Stegner et al. (2014),
which contains one stream split and one independent variable, and the
achieved TAC is 139,407$/yr.
Table 6.30 Problem data for H6C5 (Silva et al., 2010).
2
_
Stream T in (K) T out (K) C (kW/K) α (kW/m K) Cost ($/kWyr)
H1 1113 313 4.9894 1.5
H2 349 318 4.684 1.5
H3 323 313 0.772 1.5
H4 453 350 0.6097 1.5
H5 453 452 292.7 0.8
H6 363 318 3.066 1.5
C1 297 298 329.8 0.8
C2 298 343 0.5383 1.5
C3 308 395 3.727 1.5
C4 363 453 0.6097 1.5
C5 453 454 2581.1 0.8
HU 503 503 1.5 110
CU 293 313 0.8 15
0.81 2
Heat exchanger cost¼9094+485A $/yr (A in m )
Total annual cost ($/yr)
Solutions in the literature Reported Revised
Stegner et al. (2014) 139,400 139,407
Pava ˜o et al. (2017b) 139,453 139,491
Wang et al. (2017) a 139,775 139,775
Silva et al. (2010) 139,777 140,141
Pava ˜o et al. (2016) 140,068
a
No stream split.