
Page 315 - Design and Operation of Heat Exchangers and their Networks
P. 315
Optimal design of heat exchanger networks 301
Example H6C5—cont’d
1323.7
2581.1 54.9 31.9
1113 313
H1
(4.9894)
145.2
349 318
H2
(4.684)
7.7
323 313
H3
(0.772)
23.9 38.9
453 350
H4
(0.6097)
292.4 0.3
453 318
H5
(292.7)
138.0
363 452
H6
(3.066)
298 297
(329.8) C1
343 (147.9407) 298
C2
(0.5383)
395 308
C3
(3.727)
453 363 C4
(0.6097)
454 453
C5
(2581.1)
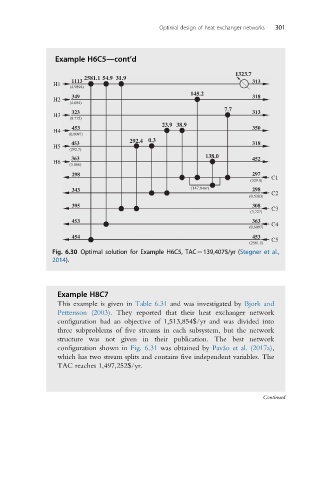
Fig. 6.30 Optimal solution for Example H6C5, TAC¼139,407$/yr (Stegner et al.,
2014).
Example H8C7
This example is given in Table 6.31 and was investigated by Bjork and
Pettersson (2003). They reported that their heat exchanger network
configuration had an objective of 1,513,854$/yr and was divided into
three subproblems of five streams in each subsystem, but the network
structure was not given in their publication. The best network
configuration shown in Fig. 6.31 was obtained by Pava ˜o et al. (2017a),
which has two stream splits and contains five independent variables. The
TAC reaches 1,497,252$/yr.
Continued