
Page 188 - Design for Six Sigma a Roadmap for Product Development
P. 188
Design for Six Sigma Project Algorithm 161
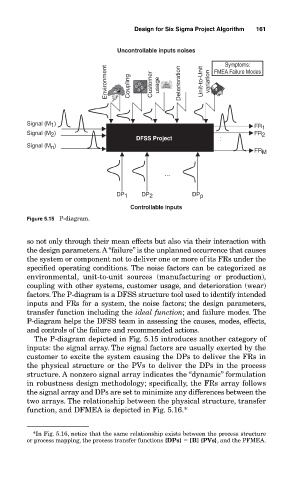
Uncontrollable inputs noises
Symptoms:
Environment Coupling Customer usage Deterioration Unit-to-Unit variation
FMEA Failure Modes
Signal (M ) FR 1
1
Signal (M ) FR 2
2
DFSS Project : :
Signal (M )
n
FR M
…
DP 1 DP 2 DP p
Controllable inputs
Figure 5.15 P-diagram.
so not only through their mean effects but also via their interaction with
the design parameters.A “failure” is the unplanned occurrence that causes
the system or component not to deliver one or more of its FRs under the
specified operating conditions. The noise factors can be categorized as
environmental, unit-to-unit sources (manufacturing or production),
coupling with other systems, customer usage, and deterioration (wear)
factors. The P-diagram is a DFSS structure tool used to identify intended
inputs and FRs for a system, the noise factors; the design parameters,
transfer function including the ideal function; and failure modes. The
P-diagram helps the DFSS team in assessing the causes, modes, effects,
and controls of the failure and recommended actions.
The P-diagram depicted in Fig. 5.15 introduces another category of
inputs: the signal array. The signal factors are usually exerted by the
customer to excite the system causing the DPs to deliver the FRs in
the physical structure or the PVs to deliver the DPs in the process
structure. A nonzero signal array indicates the “dynamic” formulation
in robustness design methodology; specifically, the FRs array follows
the signal array and DPs are set to minimize any differences between the
two arrays. The relationship between the physical structure, transfer
function, and DFMEA is depicted in Fig. 5.16.*
*In Fig. 5.16, notice that the same relationship exists between the process structure
or process mapping, the process transfer functions {DPs} [B] {PVs}, and the PFMEA.