
Page 322 - Design for Six Sigma for Service (Six SIGMA Operational Methods)
P. 322
8. Production time
7. Production cost
capability/means
6. Production spec/
5. R&D interface
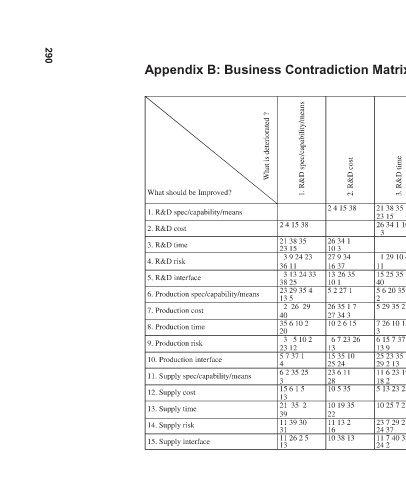
Appendix B: Business Contradiction Matrix (Mann 2004)
4. R&D risk
21 38 35 35 6 10 2 20 2 26 29 23 29 35 4 3 13 24 33 3 9 24 23 40 13 5 38 25 36 11 23 15 10 2 6 15 26 35 1 7 26 35 1 7 27 13 26 35 10 27 9 34 16 26 34 1 10 27 34 3 34 3 1 37 3 7 26 10 15 3 5 29 35 2 5 6 20 35 2 15 25 35 1 1 29 1
3. R&D time
2 4 15 38 26 34 1 10 3 27 9 34 16 37 13 26 35 10 1 5 2 27 1 26 35 1 7 27 34 3 10 2 6 15 6 7 23 26 13 15 35 10 25 24 23 6 11 28 10 5 35 10 19 35 22 11 13 2 16 10 38 13
2. R&D cost
2 4 15 38 21 38 35 23 15 3 9 24 23 36 11 3 13 24 33 38 25 23 29 35 4 13 5 2 26 29 40 35 6 10 2 20 3 5 10 2 23 12 5 7 37 1 4 6 2 35 25 3 15 6 1 5 13 21 35 2 39 11 39 30 31 11 26 2 5 13
1. R&D spec/capability/means
What is deteriorated ?
What should be Improved? 1. R&D spec/capability/means 2. R&D cost 3. R&D time 4. R&D risk 5. R&D interface 6. Production spec/capability/means 7. Production cost 8. Production time 9. Production risk 10. Production interface 11. Supply spec/capability/mea
290