
Page 338 - Design of Reinforced Masonry Structures
P. 338
5.58 CHAPTER FIVE
400
350 1
2
300
3
φ P n (kip) 250 4
200
150 5
6
100
7
50 8
11 9
12 10
0
0 500 1000 1500 2000
φ M n (kip-in)
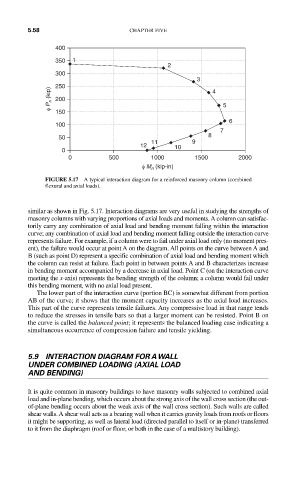
FIGURE 5.17 A typical interaction diagram for a reinforced masonry column (combined
flexural and axial loads).
similar as shown in Fig. 5.17. Interaction diagrams are very useful in studying the strengths of
masonry columns with varying proportions of axial loads and moments. A column can satisfac-
torily carry any combination of axial load and bending moment falling within the interaction
curve; any combination of axial load and bending moment falling outside the interaction curve
represents failure. For example, if a column were to fail under axial load only (no moment pres-
ent), the failure would occur at point A on the diagram. All points on the curve between A and
B (such as point D) represent a specific combination of axial load and bending moment which
the column can resist at failure. Each point in between points A and B characterizes increase
in bending moment accompanied by a decrease in axial load. Point C (on the interaction curve
meeting the x-axis) represents the bending strength of the column; a column would fail under
this bending moment, with no axial load present.
The lower part of the interaction curve (portion BC) is somewhat different from portion
AB of the curve; it shows that the moment capacity increases as the axial load increases.
This part of the curve represents tensile failures. Any compressive load in that range tends
to reduce the stresses in tensile bars so that a larger moment can be resisted. Point B on
the curve is called the balanced point; it represents the balanced loading case indicating a
simultaneous occurrence of compression failure and tensile yielding.
5.9 INTERACTION DIAGRAM FOR A WALL
UNDER COMBINED LOADING (AXIAL LOAD
AND BENDING)
It is quite common in masonry buildings to have masonry walls subjected to combined axial
load and in-plane bending, which occurs about the strong axis of the wall cross section (the out-
of-plane bending occurs about the weak axis of the wall cross section). Such walls are called
shear walls. A shear wall acts as a bearing wall when it carries gravity loads from roofs or floors
it might be supporting, as well as lateral load (directed parallel to itself or in-plane) transferred
to it from the diaphragm (roof or floor, or both in the case of a multistory building).