
Page 337 - Design of Reinforced Masonry Structures
P. 337
COLUMNS 5.57
Taking moments of C , C , about T, we obtain,
m
s
m( )
(
−
M =− C d d′)+ C d − a
n s
2
(
.
−
(
=−211 19825 38 ) + 74 19 825− 297 )
.
.
.
9.
2
=− 33 81 1357 16
+
.
.
= 1323 53 k-in. 1110 3. k-ft
=
.
φ M = 0 9 1327 94) = 1195 1 k-in = 99.6 k-ft
6
.
.(
.
.
n
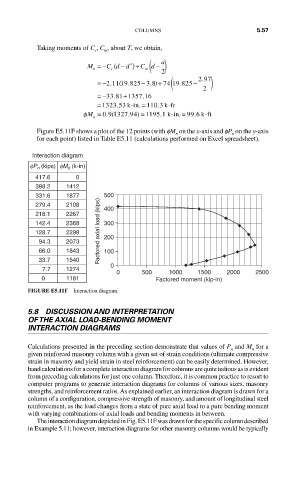
Figure E5.11F shows a plot of the 12 points (with fM on the x-axis and fP on the y-axis
n
n
for each point) listed in Table E5.11 (calculations performed on Excel spreadsheet).
Interaction diagram
fP n (kips) fM n (k-in)
417.6 0
398.2 1412
331.6 1877 500
279.4 2108 400
218.1 2267
142.4 2368 300
128.7 2298 Factored axial load (kips) 200
94.3 2073
66.0 1843 100
33.7 1540
7.7 1274 0
0 500 1000 1500 2000 2500
0 1181 Factored moment (kip-in)
FIGURE E5.11F Interaction diagram.
5.8 DISCUSSION AND INTERPRETATION
OF THE AXIAL LOAD-BENDING MOMENT
INTERACTION DIAGRAMS
Calculations presented in the preceding section demonstrate that values of P and M for a
n
n
given reinforced masonry column with a given set of strain conditions (ultimate compressive
strain in masonry and yield strain in steel reinforcement) can be easily determined. However,
hand calculations for a complete interaction diagram for columns are quite tedious as is evident
from preceding calculations for just one column. Therefore, it is common practice to resort to
computer programs to generate interaction diagrams for columns of various sizes, masonry
strengths, and reinforcement ratios. As explained earlier, an interaction diagram is drawn for a
column of a configuration, compressive strength of masonry, and amount of longitudinal steel
reinforcement, as the load changes from a state of pure axial load to a pure bending moment
with varying combinations of axial loads and bending moments in between.
The interaction diagram depicted in Fig. E5.11F was drawn for the specific column described
in Example 5.11; however, interaction diagrams for other masonry columns would be typically