
Page 204 - Design of Solar Thermal Power Plants
P. 204
3.3 THERMAL PERFORMANCE OF PARABOLIC TROUGH COLLECTOR 189
15
10
Temperature Difference ( °C ) -5
5
0
-10
-15
-20
10:00 11:00 12:00 13:00 14:00 15:00 16:00
Time ( HH:MM )
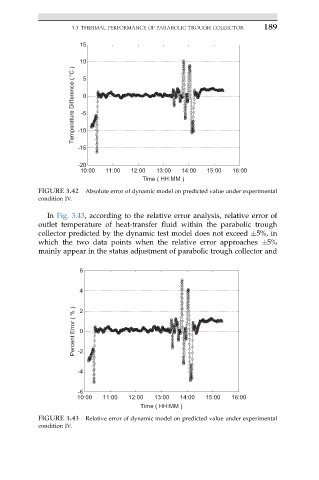
FIGURE 3.42 Absolute error of dynamic model on predicted value under experimental
condition IV.
In Fig. 3.43, according to the relative error analysis, relative error of
outlet temperature of heat-transfer fluid within the parabolic trough
collector predicted by the dynamic test model does not exceed 5%, in
which the two data points when the relative error approaches 5%
mainly appear in the status adjustment of parabolic trough collector and
6
4 2
Percent Error ( % ) -2 0
-4
-6
10:00 11:00 12:00 13:00 14:00 15:00 16:00
Time ( HH:MM )
FIGURE 3.43 Relative error of dynamic model on predicted value under experimental
condition IV.