
Page 205 - Design of Solar Thermal Power Plants
P. 205
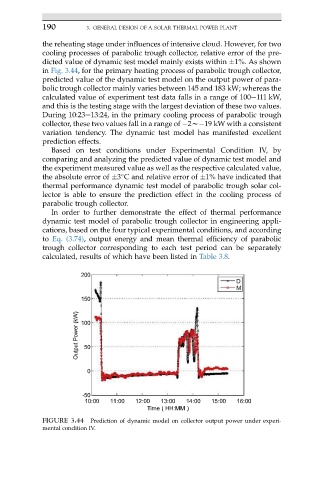
190         3. GENERAL DESIGN OF A SOLAR THERMAL POWER PLANT

            the reheating stage under influences of intensive cloud. However, for two
            cooling processes of parabolic trough collector, relative error of the pre-
            dicted value of dynamic test model mainly exists within  1%. As shown
            in Fig. 3.44, for the primary heating process of parabolic trough collector,
            predicted value of the dynamic test model on the output power of para-
            bolic trough collector mainly varies between 145 and 183 kW; whereas the
            calculated value of experiment test data falls in a range of 100e111 kW,
            and this is the testing stage with the largest deviation of these two values.
            During 10:23e13:24, in the primary cooling process of parabolic trough
            collector, these two values fall in a range of  2w 19 kW with a consistent
            variation tendency. The dynamic test model has manifested excellent
            prediction effects.
               Based on test conditions under Experimental Condition IV, by
            comparing and analyzing the predicted value of dynamic test model and
            the experiment measured value as well as the respective calculated value,

            the absolute error of  3 C and relative error of  1% have indicated that
            thermal performance dynamic test model of parabolic trough solar col-
            lector is able to ensure the prediction effect in the cooling process of
            parabolic trough collector.
               In order to further demonstrate the effect of thermal performance
            dynamic test model of parabolic trough collector in engineering appli-
            cations, based on the four typical experimental conditions, and according
            to Eq. (3.74), output energy and mean thermal efficiency of parabolic
            trough collector corresponding to each test period can be separately
            calculated, results of which have been listed in Table 3.8.

                       200
                                                                 D
                                                                 M
                       150
                      Output Power (kW)  100


                        50


                         0


                       -50
                        10:00  11:00  12:00  13:00  14:00  15:00  16:00
                                         Time ( HH:MM )
            FIGURE 3.44  Prediction of dynamic model on collector output power under experi-
            mental condition IV.