
Page 203 - Design of Solar Thermal Power Plants
P. 203
188 3. GENERAL DESIGN OF A SOLAR THERMAL POWER PLANT
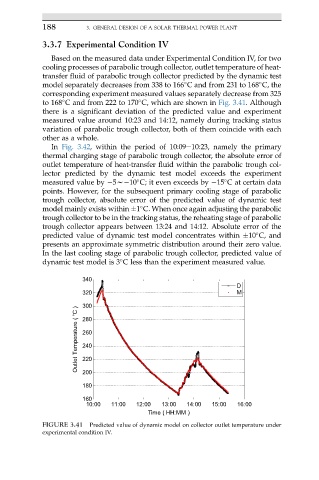
3.3.7 Experimental Condition IV
Based on the measured data under Experimental Condition IV, for two
cooling processes of parabolic trough collector, outlet temperature of heat-
transfer fluid of parabolic trough collector predicted by the dynamic test
model separately decreases from 338 to 166 C and from 231 to 168 C, the
corresponding experiment measured values separately decrease from 325
to 168 C and from 222 to 170 C, which are shown in Fig. 3.41. Although
there is a significant deviation of the predicted value and experiment
measured value around 10:23 and 14:12, namely during tracking status
variation of parabolic trough collector, both of them coincide with each
other as a whole.
In Fig. 3.42, within the period of 10:09e10:23, namely the primary
thermal charging stage of parabolic trough collector, the absolute error of
outlet temperature of heat-transfer fluid within the parabolic trough col-
lector predicted by the dynamic test model exceeds the experiment
measured value by 5w 10 C; it even exceeds by 15 C at certain data
points. However, for the subsequent primary cooling stage of parabolic
trough collector, absolute error of the predicted value of dynamic test
model mainly exists within 1 C. When once again adjusting the parabolic
trough collector to be in the tracking status, the reheating stage of parabolic
trough collector appears between 13:24 and 14:12. Absolute error of the
predicted value of dynamic test model concentrates within 10 C, and
presents an approximate symmetric distribution around their zero value.
In the last cooling stage of parabolic trough collector, predicted value of
dynamic test model is 3 C less than the experiment measured value.
340
D
320 M
300
Outlet Temperature ( °C ) 280
260
240
220
200
180
160
10:00 11:00 12:00 13:00 14:00 15:00 16:00
Time ( HH:MM )
FIGURE 3.41 Predicted value of dynamic model on collector outlet temperature under
experimental condition IV.