
Page 199 - Design of Solar Thermal Power Plants
P. 199
184 3. GENERAL DESIGN OF A SOLAR THERMAL POWER PLANT
relative error within 1 min before or after 12:45 is less than 1.2%, which is
also at the nearly same level with the relative error under Experimental
Condition I. It indicates that under the natural condition without exces-
sive fluctuations and under the stable operating condition of parabolic
trough collectors, even if the inlet temperature of heat-transfer fluid
within the parabolic trough collector constantly increases, the dynamic
test model for parabolic trough collector is able to show a considerable
thermal performance prediction effect.
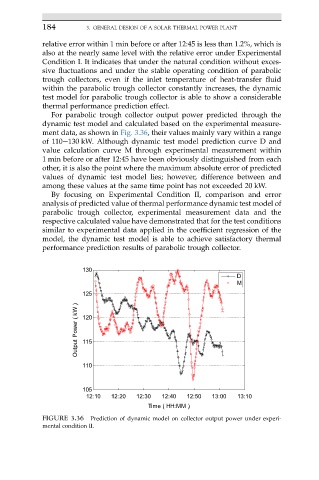
For parabolic trough collector output power predicted through the
dynamic test model and calculated based on the experimental measure-
ment data, as shown in Fig. 3.36, their values mainly vary within a range
of 110e130 kW. Although dynamic test model prediction curve D and
value calculation curve M through experimental measurement within
1 min before or after 12:45 have been obviously distinguished from each
other, it is also the point where the maximum absolute error of predicted
values of dynamic test model lies; however, difference between and
among these values at the same time point has not exceeded 20 kW.
By focusing on Experimental Condition II, comparison and error
analysis of predicted value of thermal performance dynamic test model of
parabolic trough collector, experimental measurement data and the
respective calculated value have demonstrated that for the test conditions
similar to experimental data applied in the coefficient regression of the
model, the dynamic test model is able to achieve satisfactory thermal
performance prediction results of parabolic trough collector.
130
D
M
125
Output Power ( kW ) 120
115
110
105
12:10 12:20 12:30 12:40 12:50 13:00 13:10
Time ( HH:MM )
FIGURE 3.36 Prediction of dynamic model on collector output power under experi-
mental condition II.