
Page 197 - Design of Solar Thermal Power Plants
P. 197
182 3. GENERAL DESIGN OF A SOLAR THERMAL POWER PLANT
trough collector, most of the data coincide with each other. This is because
an undetermined coefficient of dynamic test model has been obtained
through regression of this group of experimental data.
3.3.5 Experimental Condition II
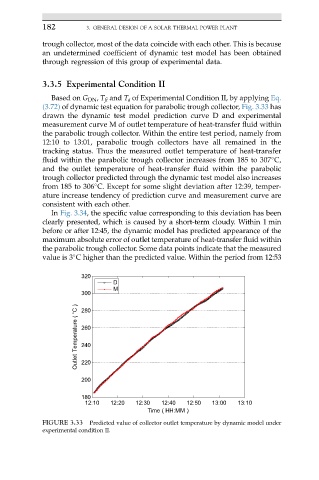
Based on G DN , T fi and T a of Experimental Condition II, by applying Eq.
(3.72) of dynamic test equation for parabolic trough collector, Fig. 3.33 has
drawn the dynamic test model prediction curve D and experimental
measurement curve M of outlet temperature of heat-transfer fluid within
the parabolic trough collector. Within the entire test period, namely from
12:10 to 13:01, parabolic trough collectors have all remained in the
tracking status. Thus the measured outlet temperature of heat-transfer
fluid within the parabolic trough collector increases from 185 to 307 C,
and the outlet temperature of heat-transfer fluid within the parabolic
trough collector predicted through the dynamic test model also increases
from 185 to 306 C. Except for some slight deviation after 12:39, temper-
ature increase tendency of prediction curve and measurement curve are
consistent with each other.
In Fig. 3.34, the specific value corresponding to this deviation has been
clearly presented, which is caused by a short-term cloudy. Within 1 min
before or after 12:45, the dynamic model has predicted appearance of the
maximum absolute error of outlet temperature of heat-transfer fluid within
the parabolic trough collector. Some data points indicate that the measured
value is 3 C higher than the predicted value. Within the period from 12:53
320
D
M
300
Outlet Temperature ( °C ) 260
280
240
220
200
180
12:10 12:20 12:30 12:40 12:50 13:00 13:10
Time ( HH:MM )
FIGURE 3.33 Predicted value of collector outlet temperature by dynamic model under
experimental condition II.