
Page 195 - Design of Solar Thermal Power Plants
P. 195
180 3. GENERAL DESIGN OF A SOLAR THERMAL POWER PLANT
temperature 326 C of heat-transfer fluid within the parabolic trough
collector obtained through experimental measurement appears at 11:16,
whereas the predicted maximum outlet temperature 332 C of heat-
transfer fluid within the parabolic trough collector by the dynamic test
equation appears at 11:17. Such a difference is mainly caused by the
necessary time to rotate the aperture of receiver of parabolic trough col-
lector to the poor-light side. Within this tracker adjustment period, the
actual incidence of solar direct radiation onto the aperture surface of a
parabolic trough collector cannot reduce to zero instantaneously. Thus
prediction by applying this dynamic test model may result in lagging and
errors.
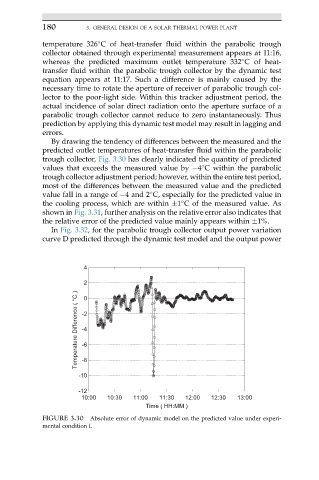
By drawing the tendency of differences between the measured and the
predicted outlet temperatures of heat-transfer fluid within the parabolic
trough collector, Fig. 3.30 has clearly indicated the quantity of predicted
values that exceeds the measured value by 4 C within the parabolic
trough collector adjustment period; however, within the entire test period,
most of the differences between the measured value and the predicted
value fall in a range of 4 and 2 C, especially for the predicted value in
the cooling process, which are within 1 C of the measured value. As
shown in Fig. 3.31, further analysis on the relative error also indicates that
the relative error of the predicted value mainly appears within 1%.
In Fig. 3.32, for the parabolic trough collector output power variation
curve D predicted through the dynamic test model and the output power
4
2
Temperature Difference ( °C ) -2
0
-4
-6
-8
-10
-12
10:00 10:30 11:00 11:30 12:00 12:30 13:00
Time ( HH:MM )
FIGURE 3.30 Absolute error of dynamic model on the predicted value under experi-
mental condition I.