
Page 198 - Design of Solar Thermal Power Plants
P. 198
3.3 THERMAL PERFORMANCE OF PARABOLIC TROUGH COLLECTOR 183
3.5
3 2
Temperature Difference ( °C ) 1.5 1 0
2.5
0.5
-0.5
-1
-1.5
12:10 12:20 12:30 12:40 12:50 13:00 13:10
Time ( HH:MM )
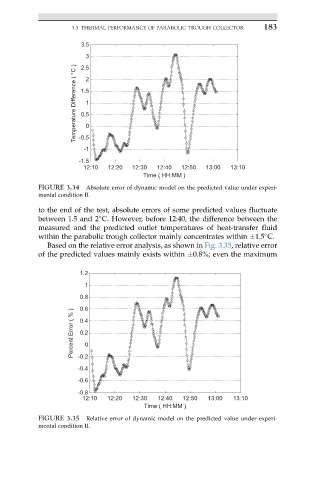
FIGURE 3.34 Absolute error of dynamic model on the predicted value under experi-
mental condition II.
to the end of the test, absolute errors of some predicted values fluctuate
between 1.5 and 2 C. However, before 12:40, the difference between the
measured and the predicted outlet temperatures of heat-transfer fluid
within the parabolic trough collector mainly concentrates within 1.5 C.
Based on the relative error analysis, as shown in Fig. 3.35, relative error
of the predicted values mainly exists within 0.8%; even the maximum
1.2
1
0.8
0.6
Percent Error ( % ) 0.4 0
0.2
-0.2
-0.4
-0.6
-0.8
12:10 12:20 12:30 12:40 12:50 13:00 13:10
Time ( HH:MM )
FIGURE 3.35 Relative error of dynamic model on the predicted value under experi-
mental condition II.