
Page 194 - Design of Solar Thermal Power Plants
P. 194
3.3 THERMAL PERFORMANCE OF PARABOLIC TROUGH COLLECTOR 179
In order to simplify the calculation, based on the observation, these
data have high degrees of linearity. Thus according to these data, a linear
equation can be obtained as follows through fitting method:
(3.75)
c oil ¼ 1528:32 þ 2:973T oil
in which T oil refers to the synthetic oil temperature. In order to specify the
reasonability and precision of this method, four typical experimental
conditions are discussed separately as follows [30].
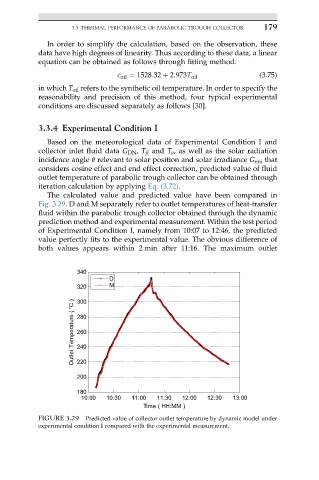
3.3.4 Experimental Condition I
Based on the meteorological data of Experimental Condition I and
collector inlet fluid data G DN , T fi and T a , as well as the solar radiation
incidence angle q relevant to solar position and solar irradiance G eni that
considers cosine effect and end effect correction, predicted value of fluid
outlet temperature of parabolic trough collector can be obtained through
iteration calculation by applying Eq. (3.72).
The calculated value and predicted value have been compared in
Fig. 3.29. D and M separately refer to outlet temperatures of heat-transfer
fluid within the parabolic trough collector obtained through the dynamic
prediction method and experimental measurement. Within the test period
of Experimental Condition I, namely from 10:07 to 12:46, the predicted
value perfectly fits to the experimental value. The obvious difference of
both values appears within 2 min after 11:16. The maximum outlet
340
D
320 M
Outlet Temperature ( °C ) 280
300
260
240
220
200
180
10:00 10:30 11:00 11:30 12:00 12:30 13:00
Time ( HH:MM )
FIGURE 3.29 Predicted value of collector outlet temperature by dynamic model under
experimental condition I compared with the experimental measurement.