Page 196 - Design of Solar Thermal Power Plants
P. 196

3.3 THERMAL PERFORMANCE OF PARABOLIC TROUGH COLLECTOR  181

                       1
                      0.5

                       0
                    Percent Error ( % )  -1.5
                     -0.5
                       -1


                       -2
                     -2.5
                       -3

                     -3.5
                       10:00  10:30  11:00  11:30  12:00  12:30  13:00
                                        Time ( HH:MM )
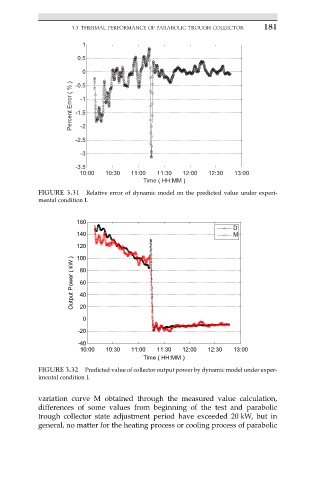
           FIGURE 3.31  Relative error of dynamic model on the predicted value under experi-
           mental condition I.


                      160
                                                                D
                      140                                       M
                      120
                      100
                     Output Power ( kW )  80

                       60
                       40
                       20
                       0

                      -20
                      -40
                       10:00  10:30  11:00  11:30  12:00  12:30  13:00
                                        Time ( HH:MM )
           FIGURE 3.32  Predicted value of collector output power by dynamic model under exper-
           imental condition I.


           variation curve M obtained through the measured value calculation,
           differences of some values from beginning of the test and parabolic
           trough collector state adjustment period have exceeded 20 kW, but in
           general, no matter for the heating process or cooling process of parabolic
   191   192   193   194   195   196   197   198   199   200   201