
Page 201 - Design of Solar Thermal Power Plants
P. 201
186 3. GENERAL DESIGN OF A SOLAR THERMAL POWER PLANT
15
10
Temperature Difference ( °C ) -5
5
0
-10
-15
10:30 10:40 10:50 11:00 11:10 11:20 11:30 11:40
Time ( HH:MM )
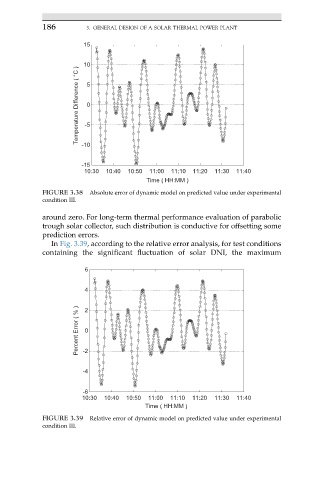
FIGURE 3.38 Absolute error of dynamic model on predicted value under experimental
condition III.
around zero. For long-term thermal performance evaluation of parabolic
trough solar collector, such distribution is conductive for offsetting some
prediction errors.
In Fig. 3.39, according to the relative error analysis, for test conditions
containing the significant fluctuation of solar DNI, the maximum
6
4 2
Percent Error ( % ) -2 0
-4
-6
10:30 10:40 10:50 11:00 11:10 11:20 11:30 11:40
Time ( HH:MM )
FIGURE 3.39 Relative error of dynamic model on predicted value under experimental
condition III.