
Page 200 - Design of Solar Thermal Power Plants
P. 200
3.3 THERMAL PERFORMANCE OF PARABOLIC TROUGH COLLECTOR 185
3.3.6 Experimental Condition III
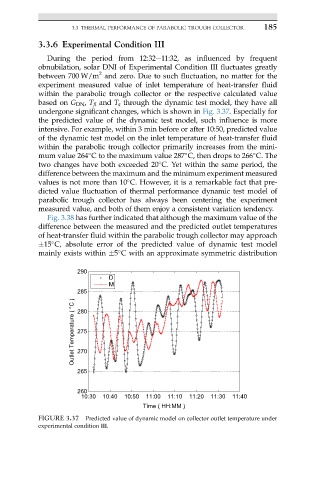
During the period from 12:32e11:32, as influenced by frequent
obnubilation, solar DNI of Experimental Condition III fluctuates greatly
2
between 700 W/m and zero. Due to such fluctuation, no matter for the
experiment measured value of inlet temperature of heat-transfer fluid
within the parabolic trough collector or the respective calculated value
based on G DN , T fi and T a through the dynamic test model, they have all
undergone significant changes, which is shown in Fig. 3.37. Especially for
the predicted value of the dynamic test model, such influence is more
intensive. For example, within 3 min before or after 10:50, predicted value
of the dynamic test model on the inlet temperature of heat-transfer fluid
within the parabolic trough collector primarily increases from the mini-
mum value 264 C to the maximum value 287 C, then drops to 266 C. The
two changes have both exceeded 20 C. Yet within the same period, the
difference between the maximum and the minimum experiment measured
values is not more than 10 C. However, it is a remarkable fact that pre-
dicted value fluctuation of thermal performance dynamic test model of
parabolic trough collector has always been centering the experiment
measured value, and both of them enjoy a consistent variation tendency.
Fig. 3.38 has further indicated that although the maximum value of the
difference between the measured and the predicted outlet temperatures
of heat-transfer fluid within the parabolic trough collector may approach
15 C, absolute error of the predicted value of dynamic test model
mainly exists within 5 C with an approximate symmetric distribution
290
D
M
285
Outlet Temperature ( °C ) 275
280
270
265
260
10:30 10:40 10:50 11:00 11:10 11:20 11:30 11:40
Time ( HH:MM )
FIGURE 3.37 Predicted value of dynamic model on collector outlet temperature under
experimental condition III.