
Page 192 - Design of Solar Thermal Power Plants
P. 192
3.3 THERMAL PERFORMANCE OF PARABOLIC TROUGH COLLECTOR 177
mathematical method of MLR, an identified equation for thermal per-
formance dynamic test of parabolic trough collector can be obtained as
follows:
q q dT fo
2
T fo T fi ¼ 0:182 0:00731 þ 0:000106 G eni 68:379
cosðqÞ cosðqÞ ds
dT fi 2
þ 33:941 0:00571ðT T a Þ 0:0000217ðT T a Þ
fi
fi
ds
(3.73)
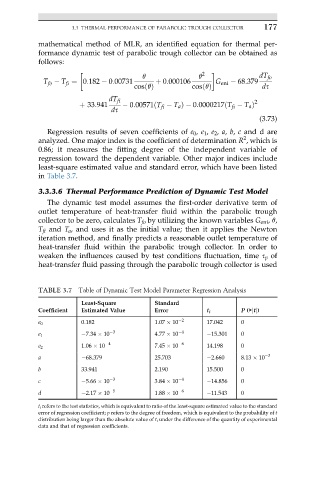
Regression results of seven coefficients of e 0 , e 1 , e 2 , a, b, c and d are
2
analyzed. One major index is the coefficient of determination R , which is
0.86; it measures the fitting degree of the independent variable of
regression toward the dependent variable. Other major indices include
least-square estimated value and standard error, which have been listed
in Table 3.7.
3.3.3.6 Thermal Performance Prediction of Dynamic Test Model
The dynamic test model assumes the first-order derivative term of
outlet temperature of heat-transfer fluid within the parabolic trough
collector to be zero, calculates T fo by utilizing the known variables G eni , q,
T fi and T a , and uses it as the initial value; then it applies the Newton
iteration method, and finally predicts a reasonable outlet temperature of
heat-transfer fluid within the parabolic trough collector. In order to
weaken the influences caused by test conditions fluctuation, time s p of
heat-transfer fluid passing through the parabolic trough collector is used
TABLE 3.7 Table of Dynamic Test Model Parameter Regression Analysis
Least-Square Standard
Coefficient Estimated Value Error t i P (>jtj)
0.182 1.07 10 2 17.042 0
e 0
7.34 10 3 4.77 10 4 15.301 0
e 1
1.06 10 4 7.45 10 6 14.198 0
e 2
a 68.379 25.703 2.660 8.13 10 3
b 33.941 2.190 15.500 0
c 5.66 10 3 3.84 10 4 14.856 0
d 2.17 10 5 1.88 10 6 11.543 0
t i refers to the test statistics, which is equivalent to ratio of the least-square estimated value to the standard
error of regression coefficient; p refers to the degree of freedom, which is equivalent to the probability of t
distribution being larger than the absolute value of t i under the difference of the quantity of experimental
data and that of regression coefficients.