
Page 293 - Digital Analysis of Remotely Sensed Imagery
P. 293
Spectral Image Analysis 255
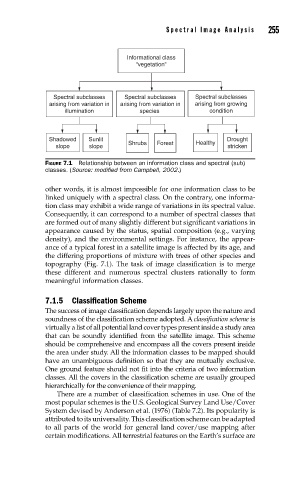
Informational class
“vegetation”
Spectral subclasses Spectral subclasses Spectral subclasses
arising from variation in arising from variation in arising from growing
illumination species condition
Shadowed Sunlit Healthy Drought
slope slope Shrubs Forest stricken
FIGURE 7.1 Relationship between an information class and spectral (sub)
classes. (Source: modifi ed from Campbell, 2002.)
other words, it is almost impossible for one information class to be
linked uniquely with a spectral class. On the contrary, one informa-
tion class may exhibit a wide range of variations in its spectral value.
Consequently, it can correspond to a number of spectral classes that
are formed out of many slightly different but significant variations in
appearance caused by the status, spatial composition (e.g., varying
density), and the environmental settings. For instance, the appear-
ance of a typical forest in a satellite image is affected by its age, and
the differing proportions of mixture with trees of other species and
topography (Fig. 7.1). The task of image classification is to merge
these different and numerous spectral clusters rationally to form
meaningful information classes.
7.1.5 Classification Scheme
The success of image classification depends largely upon the nature and
soundness of the classification scheme adopted. A classification scheme is
virtually a list of all potential land cover types present inside a study area
that can be soundly identified from the satellite image. This scheme
should be comprehensive and encompass all the covers present inside
the area under study. All the information classes to be mapped should
have an unambiguous definition so that they are mutually exclusive.
One ground feature should not fit into the criteria of two information
classes. All the covers in the classification scheme are usually grouped
hierarchically for the convenience of their mapping.
There are a number of classification schemes in use. One of the
most popular schemes is the U.S. Geological Survey Land Use/Cover
System devised by Anderson et al. (1976) (Table 7.2). Its popularity is
attributed to its universality. This classification scheme can be adapted
to all parts of the world for general land cover/use mapping after
certain modifications. All terrestrial features on the Earth’s surface are