
Page 42 - Digital Analysis of Remotely Sensed Imagery
P. 42
Overview 15
255
Band B
0
0 255
Band A
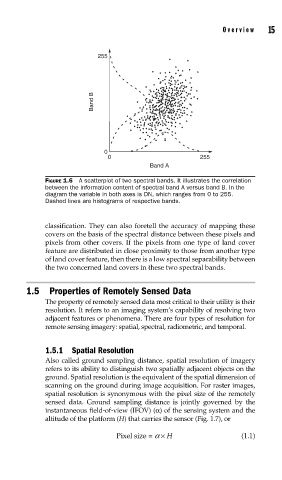
FIGURE 1.6 A scatterplot of two spectral bands. It illustrates the correlation
between the information content of spectral band A versus band B. In the
diagram the variable in both axes is DN, which ranges from 0 to 255.
Dashed lines are histograms of respective bands.
classification. They can also foretell the accuracy of mapping these
covers on the basis of the spectral distance between these pixels and
pixels from other covers. If the pixels from one type of land cover
feature are distributed in close proximity to those from another type
of land cover feature, then there is a low spectral separability between
the two concerned land covers in these two spectral bands.
1.5 Properties of Remotely Sensed Data
The property of remotely sensed data most critical to their utility is their
resolution. It refers to an imaging system’s capability of resolving two
adjacent features or phenomena. There are four types of resolution for
remote sensing imagery: spatial, spectral, radiometric, and temporal.
1.5.1 Spatial Resolution
Also called ground sampling distance, spatial resolution of imagery
refers to its ability to distinguish two spatially adjacent objects on the
ground. Spatial resolution is the equivalent of the spatial dimension of
scanning on the ground during image acquisition. For raster images,
spatial resolution is synonymous with the pixel size of the remotely
sensed data. Ground sampling distance is jointly governed by the
instantaneous field-of-view (IFOV) (α) of the sensing system and the
altitude of the platform (H) that carries the sensor (Fig. 1.7), or
Pixel size = a × H (1.1)