
Page 55 - Digital Analysis of Remotely Sensed Imagery
P. 55
28 Cha pte r T w o
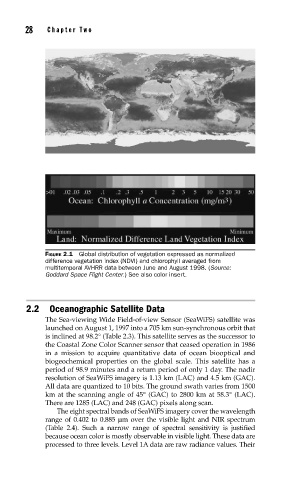
FIGURE 2.1 Global distribution of vegetation expressed as normalized
difference vegetation index (NDVI) and chlorophyll averaged from
multitemporal AVHRR data between June and August 1998. (Source:
Goddard Space Flight Center.) See also color insert.
2.2 Oceanographic Satellite Data
The Sea-viewing Wide Field-of-view Sensor (SeaWiFS) satellite was
launched on August 1, 1997 into a 705 km sun-synchronous orbit that
is inclined at 98.2° (Table 2.3). This satellite serves as the successor to
the Coastal Zone Color Scanner sensor that ceased operation in 1986
in a mission to acquire quantitative data of ocean biooptical and
biogeochemical properties on the global scale. This satellite has a
period of 98.9 minutes and a return period of only 1 day. The nadir
resolution of SeaWiFS imagery is 1.13 km (LAC) and 4.5 km (GAC).
All data are quantized to 10 bits. The ground swath varies from 1500
km at the scanning angle of 45° (GAC) to 2800 km at 58.3° (LAC).
There are 1285 (LAC) and 248 (GAC) pixels along scan.
The eight spectral bands of SeaWiFS imagery cover the wavelength
range of 0.402 to 0.885 μm over the visible light and NIR spectrum
(Table 2.4). Such a narrow range of spectral sensitivity is justified
because ocean color is mostly observable in visible light. These data are
processed to three levels. Level 1A data are raw radiance values. Their