
Page 74 - Digital Analysis of Remotely Sensed Imagery
P. 74
46 Cha pte r T w o
VNIR imagery with its high resolution allows the production of
small-scale topographic maps and DEMs, especially in mountainous
areas. In addition, ASTER TIR bands are suited to creation of detailed
maps of land surface temperature, emissivity, and reflectance.
2.3.5 MODIS Data
The MODIS instrument is another key sensor aboard the Terra (EOS
AM) and Aqua (EOS PM) satellites. This sensor is able to cover the
entire Earth in 1 to 2 days. Its total FOV of ±55° combined with a
satellite altitude of 705 km enables a swath width of 2330 km to be
scanned using cross-track scanning. The MODIS multispectral
radiometer captures solar radiation over the wavelength range of
0.405 to 14.385 μm in 36 spectral bands at three spatial resolutions
ranging from 250 m (bands 1 and 2) to 1000 m (Table 2.16). Five bands
have a spatial resolution of 500 m and the remaining 29 spectral bands
have a spatial resolution of 1 km, all quantized to 12 bits.
MODIS data are processed to several levels, ranging from
level 0 to level 1B. In total, 44 standard MODIS data products are
available to approved users at minimal or no cost. Thanks to its
wide sweeping swath and a larger number of spectral bands (36),
MODIS represents a significant improvement over AVHRR imagery
in sensing a wide array of terrestrial processes. MODIS data will
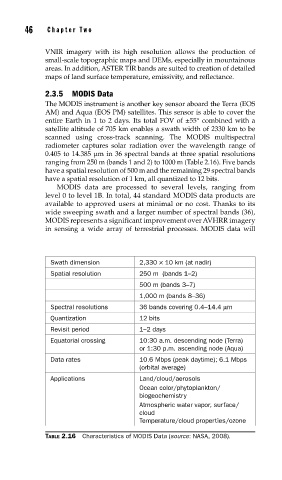
Swath dimension 2,330 × 10 km (at nadir)
Spatial resolution 250 m (bands 1–2)
500 m (bands 3–7)
1,000 m (bands 8–36)
Spectral resolutions 36 bands covering 0.4–14.4 μm
Quantization 12 bits
Revisit period 1–2 days
Equatorial crossing 10:30 a.m. descending node (Terra)
or 1:30 p.m. ascending node (Aqua)
Data rates 10.6 Mbps (peak daytime); 6.1 Mbps
(orbital average)
Applications Land/cloud/aerosols
Ocean color/phytoplankton/
biogeochemistry
Atmospheric water vapor, surface/
cloud
Temperature/cloud properties/ozone
TABLE 2.16 Characteristics of MODIS Data (source: NASA, 2008).