
Page 475 - Dust Explosions in the Process Industries
P. 475
442 Dust Explosions in the Process industries
the vent areas for Ks, = 200 bar m/s and 100bar m/s for the 20 m3 silo and a given max-
imum pressure also apply to the 236 m3silo (geometrical similarity).This makes it pos-
sible to estimate theoretical Radandt predictions for Ks, = 100bar m/s, even for 236 m3,
by shifting the Radandt curve for 200 bar m/s and 236 m3to the left by A (log A).
The actual experimental maximum explosion pressures found in the 236 m3 silo of
LID = 6 are partly considerably higher, partly considerably lower than the estimated
Radandt value for Ks, = 100 bar m/s. On the other hand, even the highest experimental
pressure of 1.2bar(& is significantlylower than the Radandt value of 1.75bar(g) for Ks, =
200 bar m/s (St 1dusts).
It must be concluded that, so far, the relevance of and experimentaland theoreticalbasis
for the simple scaling law suggested by Radandt have not been fully substantiated.
All the dust clouds in the large-scale silo experimentsreported by Eckhoff and cowork-
ers were generated by pneumatic pipeline injection, in accordance with typical indus-
trial practice. After a series of experiments using the VDI-method for dust cloud
generation, as described by Radandt (1983), Bartknecht and Radandt decided to adopt
pneumatic pipeline injection, even in their 20 m3 silo experiments, as discussed by
Bartknecht (1988).This was a significant decision, reflecting the appreciation of the need
for conducting experimentsin accordance with reality in industry.In fact, Bartknecht and
Radandt took a further, most relevant step, by adding experimentsin which the dust was
not injected directly into the silo but via a cyclone at the silo top. In this way, the dust
cloud in the silo, generated by discharge of dust from the cyclone bottom via a rotary
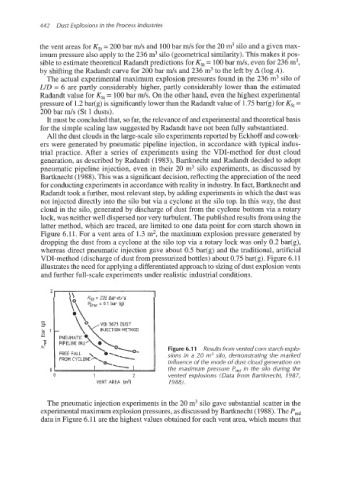
lock, was neither well dispersed nor very turbulent.The publishedresults from using the
latter method, which are traced, are limited to one data point for corn starch shown in
Figure 6.11. For a vent area of 1.3 m2,the maximum explosion pressure generated by
dropping the dust from a cyclone at the silo top via a rotary lock was only 0.2 bar(&
whereas direct pneumatic injection gave about 0.5 bar(@ and the traditional, artificial
VDI-method (discharge of dust from pressurized bottles) about 0.75 bar(g). Figure 6.11
illustrates the need for applying a differentiatedapproachto sizing of dust explosionvents
and further full-scale experiments under realistic industrial conditions.
2
Ks+ = 226 bar.m/s
Star= 0.1 bar (g)
m VDI 3673 DUST
INJECTION METHOD
---
L1 Figure 6.1 1 Results from ventedcorn starch explo-
FREE FALL \ e-- OlO- sions in a 20 m3 silo, demonstrating the marked
FROM CY CLONE*
‘ck +--. I influence of the mode of dust cloud generation on
0 the maximum pressure Predin the silo during the
0 1 2 vented explosions (Data from Bartknecht, 1987,
VENT AREA lm21 1988).
The pneumatic injection experiments in the 20 m3silo gave substantial scatter in the
experimentalmaximum explosionpressures, as discussed by Bartknecht (1988).The Pred
data in Figure 6.11 are the highest values obtained for each vent area, which means that