
Page 166 - Dynamic Loading and Design of Structures
P. 166
Page 142
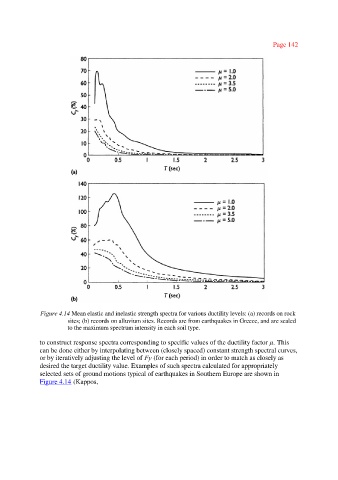
Figure 4.14 Mean elastic and inelastic strength spectra for various ductility levels: (a) records on rock
sites; (b) records on alluvium sites. Records are from earthquakes in Greece, and are scaled
to the maximum spectrum intensity in each soil type.
to construct response spectra corresponding to specific values of the ductility factor µ. This
can be done either by interpolating between (closely spaced) constant strength spectral curves,
or by iteratively adjusting the level of Fy (for each period) in order to match as closely as
desired the target ductility value. Examples of such spectra calculated for appropriately
selected sets of ground motions typical of earthquakes in Southern Europe are shown in
Figure 4.14 (Kappos,