
Page 161 - Dynamic Loading and Design of Structures
P. 161
Page 137
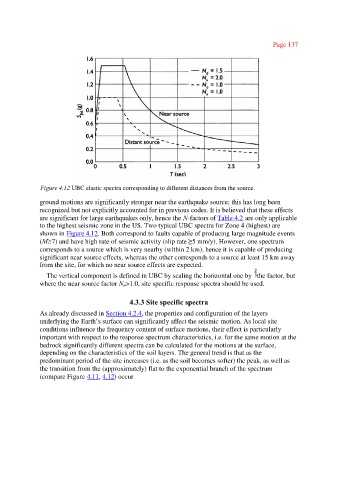
Figure 4.12 UBC elastic spectra corresponding to different distances from the source.
ground motions are significantly stronger near the earthquake source; this has long been
recognized but not explicitly accounted for in previous codes. It is believed that these effects
are significant for large earthquakes only, hence the N-factors of Table 4.2 are only applicable
to the highest seismic zone in the US. Two typical UBC spectra for Zone 4 (highest) are
shown in Figure 4.12. Both correspond to faults capable of producing large magnitude events
(M≥7) and have high rate of seismic activity (slip rate ≥5 mm/y). However, one spectrum
corresponds to a source which is very nearby (within 2 km), hence it is capable of producing
significant near source effects, whereas the other corresponds to a source at least 15 km away
from the site, for which no near source effects are expected.
The vertical component is defined in UBC by scaling the horizontal one by the factor, but
where the near source factor Na>1.0, site specific response spectra should be used.
4.3.3 Site specific spectra
As already discussed in Section 4.2.4, the properties and configuration of the layers
underlying the Earth’s surface can significantly affect the seismic motion. As local site
conditions influence the frequency content of surface motions, their effect is particularly
important with respect to the response spectrum characteristics, i.e. for the same motion at the
bedrock significantly different spectra can be calculated for the motions at the surface,
depending on the characteristics of the soil layers. The general trend is that as the
predominant period of the site increases (i.e. as the soil becomes softer) the peak, as well as
the transition from the (approximately) flat to the exponential branch of the spectrum
(compare Figure 4.11, 4.12) occur