
Page 162 - Dynamic Loading and Design of Structures
P. 162
Page 138
at longer periods; these periods are close to, but not necessarily the same as, the predominant
period of the site. Referring to Figure 4.9, it is seen that the response spectrum for the
accelerogram from Mexico City, recorded at a station (SCT building) underlain by about 40 m
of soft clay (having an average shear wave velocity of only 75 m/sec) has its peaks in the
range around 2 sec, whereas the other two motions recorded on much firmer soils are
characterized by peaks at much shorter periods (around 0.5 sec). Until relatively recently, it
was thought that for sites consisting of soft to medium clays the amplification of the
acceleration in the short period range tends to be somewhat lower than the corresponding
values for rock and stiff soils (Commentary to NEHRP Provisions, FEMA, 1995).
Recognizing the aforementioned trends, EC8 defines the site specific elastic response
spectrum by modifying the basic shape of Figure 4.11 in two ways:
●by increasing the corner periods TB and Tc in the case of softer soils;
●by decreasing the value of S pa in the short period range for softer soils (soil factor S).
Of particular practical importance is the way soils are classified (into three classes in EC8),
for design purposes; classification must be precise enough to avoid ambigu-ities, but also
simple enough to avoid the need for costly detailed geotechnical investigations in the case of
usual structures. The best indicator is probably the shear wave velocity of a soil layer, which
captures the effect of both stiffness (through the shear modulus G) and density, as shown by
eqn (4.1). In addition to this, the depth of each layer for which a constant vs can be assumed is
also of importance, while site amplification is further influenced by soil damping and the
geometry (configuration) of the subsurface.
In situ measurements of the v profile by in-hole geophysical methods such as down-hole or
s
cross-hole tests (see description in Kramer, 1996) are strongly recommended for important
structures and/or high seismicity. In other cases, empirical correlations of vs with other
geotechnical properties, typically the cone penetration resistance, may be used. The
difference between the small strain values of v (as measured by in situ tests) and the strain
s
values anticipated during the design earthquake must be taken into account.
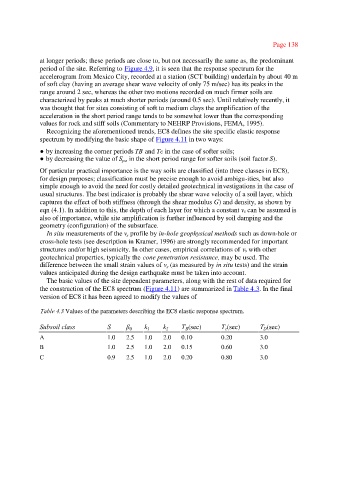
The basic values of the site dependent parameters, along with the rest of data required for
the construction of the EC8 spectrum (Figure 4.11) are summarized in Table 4.3. In the final
version of EC8 it has been agreed to modify the values of
Table 4.3 Values of the parameters describing the EC8 elastic response spectrum.
Subsoil class S β k 1 k 2 T (sec) T (sec) T (sec)
B
c
D
0
A 1.0 2.5 1.0 2.0 0.10 0.20 3.0
B 1.0 2.5 1.0 2.0 0.15 0.60 3.0
C 0.9 2.5 1.0 2.0 0.20 0.80 3.0