
Page 109 - Dynamic Vision for Perception and Control of Motion
P. 109
3.4 Behavioral Capabilities for Locomotion 93
tion), both longitudinal and lateral components of gravity acceleration will be 0.7 ·
a grad , yielding a sum of the components of § 141% of a grad. These facts lead to the
rule that going uphill or downhill should preferably be done in gradient direction,
especially since the width of the vehicle track, usually, is smaller than the axle dis-
tance so that the danger of toppling over after hitting a perturbation is minimized.
Horizontal longitudinal acceleration capabilities: An essential component for
judging vehicle performance is the acceleration capability from one speed level to
another, measured in seconds. Standard tests for cars are acceleration from rest to
100 km/h and from 80 to 120 km/h (e.g., for passing). Assuming a constant accel-
eration level of “1 g” (9.81 m/s²) would yield 2.83 seconds from 0 to 100 km/h.
Since the friction coefficient is, usually, less than 1, this value may be considered a
lower limit for the acceleration time from 0 to 100 km/h of very-high-performance
vehicles. Racing cars with downward aerodynamic lift can exploit higher normal
forces on the tires and thus higher acceleration levels at higher speeds if engine
power permits. Today’s premium cars typically achieve values from 4 to 8 sec-
onds, while standard cars and vans show values between 10 and 20 seconds from 0
to 100 km/h.
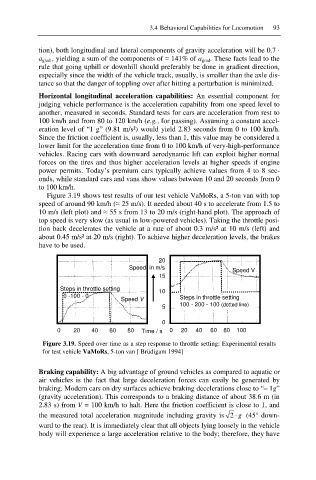
Figure 3.19 shows test results of our test vehicle VaMoRs, a 5-ton van with top
speed of around 90 km/h (§ 25 m/s). It needed about 40 s to accelerate from 1.5 to
10 m/s (left plot) and § 55 s from 13 to 20 m/s (right-hand plot). The approach of
top speed is very slow (as usual in low-powered vehicles). Taking the throttle posi-
tion back decelerates the vehicle at a rate of about 0.3 m/s² at 10 m/s (left) and
about 0.45 m/s² at 20 m/s (right). To achieve higher deceleration levels, the brakes
have to be used.
20
Speed in m/s
Speed V
15
Steps in throttle setting 10
0 -100 - 0 Steps in throttle setting
Speed V
100 - 200 - 100 (dotted line)
5
0
0 20 40 60 80 Time / s 0 20 40 60 80 100
Figure 3.19. Speed over time as a step response to throttle setting: Experimental results
for test vehicle VaMoRs, 5-ton van [ Brüdigam 1994]
Braking capability: A big advantage of ground vehicles as compared to aquatic or
air vehicles is the fact that large deceleration forces can easily be generated by
braking. Modern cars on dry surfaces achieve braking decelerations close to “– 1g”
(gravity acceleration). This corresponds to a braking distance of about 38.6 m (in
2.83 s) from V = 100 km/h to halt. Here the friction coefficient is close to 1, and
the measured total acceleration magnitude including gravity is 2 g (45° down-
ward to the rear). It is immediately clear that all objects lying loosely in the vehicle
body will experience a large acceleration relative to the body; therefore, they have