Page 228 - Academic Press Encyclopedia of Physical Science and Technology 3rd Chemical Engineering
P. 228

P1: GJC Final Pages
 Encyclopedia of Physical Science and Technology  EN004E-182  June 8, 2001  18:16


               552                                                                                       Distillation


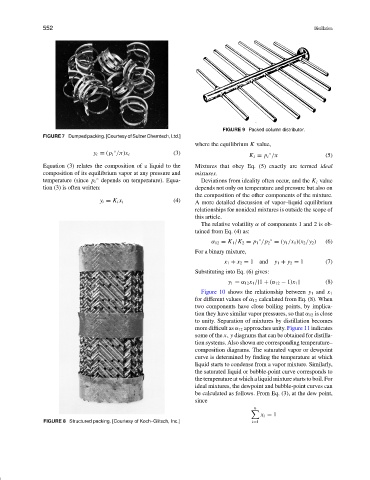
                                                                           FIGURE 9 Packed column distributor.
               FIGURE 7 Dumped packing. [Courtesy of Sulzer Chemtech, Ltd.]
                                                                 where the equilibrium K value,
                                       ◦
                                                                                   K i = p i /π              (5)
                                y i = (p i /π)x i         (3)                             ◦
               Equation (3) relates the composition of a liquid to the  Mixtures that obey Eq. (5) exactly are termed ideal
               composition of its equilibrium vapor at any pressure and  mixtures.
               temperature (since p i depends on temperature). Equa-  Deviations from ideality often occur, and the K i value
                                 ◦
               tion (3) is often written:                        depends not only on temperature and pressure but also on
                                                                 the composition of the other components of the mixture.
                                  y i = K i x i           (4)    A more detailed discussion of vapor–liquid equilibrium
                                                                 relationships for nonideal mixtures is outside the scope of
                                                                 this article.
                                                                   The relative volatility α of components 1 and 2 is ob-
                                                                 tained from Eq. (4) as:
                                                                                      ◦
                                                                                          ◦
                                                                       α 12 = K 1 /K 2 = p 1 /p 2 = (y 1 /x 1 )(x 2 /y 2 )  (6)
                                                                 For a binary mixture,
                                                                           x 1 + x 2 = 1  and  y 1 + y 2 = 1  (7)
                                                                 Substituting into Eq. (6) gives:
                                                                            y 1 = α 12 x 1 /[1 + (α 12 − 1)x 1 ]  (8)
                                                                   Figure 10 shows the relationship between  y 1 and x 1
                                                                 for different values of α 12 calculated from Eq. (8). When
                                                                 two components have close boiling points, by implica-
                                                                 tion they have similar vapor pressures, so that α 12 is close
                                                                 to unity. Separation of mixtures by distillation becomes
                                                                 more difficult as α 12  approaches unity. Figure 11 indicates
                                                                 some of the x, y diagrams that can be obtained for distilla-
                                                                 tion systems. Also shown are corresponding temperature–
                                                                 composition diagrams. The saturated vapor or dewpoint
                                                                 curve is determined by finding the temperature at which
                                                                 liquid starts to condense from a vapor mixture. Similarly,
                                                                 the saturated liquid or bubble-point curve corresponds to
                                                                 the temperature at which a liquid mixture starts to boil. For
                                                                 ideal mixtures, the dewpoint and bubble-point curves can
                                                                 be calculated as follows. From Eq. (3), at the dew point,
                                                                 since
                                                                                     n

                                                                                       x i = 1
               FIGURE 8 Structured packing. [Courtesy of Koch–Glitsch, Inc.]        i=1
   223   224   225   226   227   228   229   230   231   232   233