
Page 229 - Academic Press Encyclopedia of Physical Science and Technology 3rd Chemical Engineering
P. 229
P1: GJC Final Pages
Encyclopedia of Physical Science and Technology EN004E-182 June 8, 2001 18:16
Distillation 553
FIGURE 10 Vapor (y 1 ) versus liquid (x 1 ) concentration as a func-
tion of relative volatility.
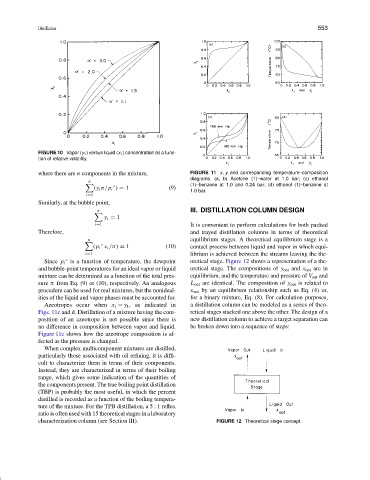
where there are n components in the mixture, FIGURE 11 x, y and corresponding temperature–composition
diagrams. (a, b) Acetone (1)–water at 1.0 bar; (c) ethanol
n
(1)–benzene at 1.0 and 0.24 bar; (d) ethanol (1)–benzene at
◦
(y i π/p i ) = 1 (9)
1.0 bar.
i=1
Similarly, at the bubble point,
n III. DISTILLATION COLUMN DESIGN
y i = 1
i=1 It is convenient to perform calculations for both packed
Therefore, and trayed distillation columns in terms of theoretical
n equilibrium stages. A theoretical equilibrium stage is a
◦
(p i x i /π) = 1 (10) contact process between liquid and vapor in which equi-
i=1 librium is achieved between the streams leaving the the-
Since p i is a function of temperature, the dewpoint oretical stage. Figure 12 shows a representation of a the-
◦
and bubble-point temperatures for an ideal vapor or liquid oretical stage. The compositions of y out and x out are in
mixture can be determined as a function of the total pres- equilibrium, and the temperature and pressure of V out and
sure π from Eq. (9) or (10), respectively. An analogous L out are identical. The composition of y out is related to
procedure can be used for real mixtures, but the nonideal- x out by an equilibrium relationship such as Eq. (4) or,
ities of the liquid and vapor phases must be accounted for. for a binary mixture, Eq. (8). For calculation purposes,
Azeotropes occur when x 1 = y 1 , as indicated in a distillation column can be modeled as a series of theo-
Figs. 11c and d. Distillation of a mixture having the com- retical stages stacked one above the other. The design of a
position of an azeotrope is not possible since there is new distillation column to achieve a target separation can
no difference in composition between vapor and liquid. be broken down into a sequence of steps:
Figure 11c shows how the azeotrope composition is af-
fected as the pressure is changed.
When complex multicomponent mixtures are distilled,
particularly those associated with oil refining, it is diffi-
cult to characterize them in terms of their components.
Instead, they are characterized in terms of their boiling
range, which gives some indication of the quantities of
the components present. The true boiling point distillation
(TBP) is probably the most useful, in which the percent
distilled is recorded as a function of the boiling tempera-
ture of the mixture. For the TPB distillation, a 5 : 1 reflux
ratio is often used with 15 theoretical stages in a laboratory
characterization column (see Section III). FIGURE 12 Theoretical stage concept.