
Page 110 - Academic Press Encyclopedia of Physical Science and Technology 3rd Polymer
P. 110
P1: FMX/LSU P2: GPB/GRD P3: GLQ Final pages
Encyclopedia of Physical Science and Technology EN012c-593 July 26, 2001 15:56
616 Polymer Processing
behind the input frequency. One component of the stress Similar flow histories can be described for shear-free
is in phase with the rate of deformation given by Eq. (9) flows as described for shear flows. Here we discuss only
and one is out of phase. When the strains are small, and steady and stress growth shear-free flows. For steady sim-
the stress is linearly proportional to strain, one is said to ple (i.e., homogeneous deformation) shear-free flows, two
be in the linear viscoelastic region. The complex viscosity viscosity functions, η 1 and η 2 , are defined based on the two
is defined as normal stress differences given in Eq. (12):
∗
η = η − i η (10) τ zz − τ xx = −¯η 1 (˙ε, b)˙ε τ yy − τ xx = −¯η 2 (˙ε, b)˙ε.
(12)
where η is the dynamic viscosity (viscous contribution)
For uniaxial extensional flow where b = 0 and ˙ε > 0,
and η is the elastic contribution associated with energy
η 2 = 0, and η 1 is called the extensional or elongational
storage per cycle of deformation. For a number of poly-
viscosity, ¯η. Most often it is not possible to reach steady-
meric resins, |η (ω)|= η( ˙γ ) when ω = ˙γ , which is known
∗
state conditions and, hence, only the stress growth data at
as the Cox–Merz relation.
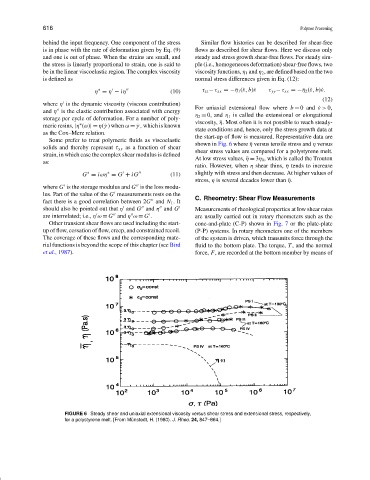
the start-up of flow is measured. Representative data are
Some prefer to treat polymeric fluids as viscoelastic
shown in Fig. 6 where ¯η versus tensile stress and η versus
solids and thereby represent τ yx as a function of shear
shear stress values are compared for a polystyrene melt.
strain, in which case the complex shear modulus is defined
At low stress values, ¯η = 3η 0 , which is called the Trouton
as:
ratio. However, when η shear thins, ¯η tends to increase
∗
∗
G = i ωη = G + iG (11) slightly with stress and then decrease. At higher values of
stress, η is several decades lower than ¯η.
where G is the storage modulus and G is the loss modu-
lus. Part of the value of the G measurements rests on the
C. Rheometry: Shear Flow Measurements
fact there is a good correlation between 2G and N 1 . It
should also be pointed out that η and G and η and G Measurements of rheological properties at low shear rates
are interrelated; i.e., η ω = G and η ω = G . are usually carried out in rotary rheometers such as the
Other transient shear flows are used including the start- cone-and-plate (C-P) shown in Fig. 7 or the plate-plate
up of flow, cessation of flow, creep, and constrained recoil. (P-P) systems. In rotary rheometers one of the members
The coverage of these flows and the corresponding mate- of the system is driven, which transmits force through the
rial functions is beyond the scope of this chapter (see Bird fluid to the bottom plate. The torque, T , and the normal
et al., 1987). force, F, are recorded at the bottom member by means of
FIGURE 6 Steady shear and uniaxial extensional viscosity versus shear stress and extensional stress, respectively,
for a polystyrene melt. [From M¨unstedt, H. (1980). J. Rheo. 24, 847–864.]