
Page 111 - Academic Press Encyclopedia of Physical Science and Technology 3rd Polymer
P. 111
P1: FMX/LSU P2: GPB/GRD P3: GLQ Final pages
Encyclopedia of Physical Science and Technology EN012c-593 July 26, 2001 15:56
Polymer Processing 617
FIGURE 7 Cone-and-plate rheometer. The geometric variables
are the cone angle, ϑ 0 , and the radius, R. The torque, T, required
to turn the cone at an angular velocity W is converted to viscosity
while the normal force exerted on the bottom plate is converted
to the primary normal stress difference.
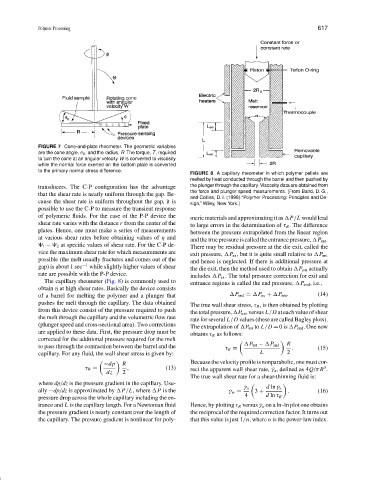
FIGURE 8 A capillary rheometer in which polymer pellets are
melted by heat conducted through the barrel and then pushed by
transducers. The C-P configuration has the advantage the plunger through the capillary. Viscosity data are obtained from
the force and plunger speed measurements. [From Baird, D. G.,
that the shear rate is nearly uniform through the gap. Be-
and Collias, D. I. (1998).“Polymer Processing: Principles and De-
cause the shear rate is uniform throughout the gap, it is sign,” Wiley, New York.]
possible to use the C-P to measure the transient response
of polymeric fluids. For the case of the P-P device the
meric materials and approximating it as P/L would lead
shear rate varies with the distance r from the center of the
to large errors in the determination of τ R . The difference
plates. Hence, one must make a series of measurements
between the pressure extrapolated from the linear region
at various shear rates before obtaining values of η and and the true pressure is called the entrance pressure, P ent .
1 − 2 at specific values of shear rate. For the C-P de- There may be residual pressure at the die exit, called the
vice the maximum shear rate for which measurements are
exit pressure, P ex , but it is quite small relative to P ent
possible (the melt usually fractures and comes out of the and hence is neglected. If there is additional pressure at
gap) is about 1 sec −1 while slightly higher values of shear the die exit, then the method used to obtain P ent actually
rate are possible with the P-P device. includes P ex . The total pressure correction for exit and
The capillary rheometer (Fig. 8) is commonly used to entrance regions is called the end pressure, P end , i.e.,
obtain η at high shear rates. Basically the device consists
of a barrel for melting the polymer and a plunger that P end = P ex + P ent . (14)
pushes the melt through the capillary. The data obtained The true wall shear stress, τ R , is then obtained by plotting
from this device consist of the pressure required to push the total pressure, P tot , versus L/D at each value of shear
the melt through the capillary and the volumetric flow rate rate for several L/D values (these are called Bagley plots).
(plunger speed and cross-sectional area). Two corrections The extrapolation of P tot to L/D = 0is P end . One now
are applied to these data. First, the pressure drop must be obtains τ R as follows:
corrected for the additional pressure required for the melt
to pass through the contraction between the barrel and the P tot − P end R
τ R = . (15)
capillary. For any fluid, the wall shear stress is given by: L 2
Because the velocity profile is nonparabolic, one must cor-
−dp R
3
τ R = , (13) rect the apparent wall shear rate, ˙γ a ,defined as 4Q/πR .
dz 2
The true wall shear rate for a shear-thinning fluid is:
where dp/dz is the pressure gradient in the capillary. Usu-
˙ γ a d ln ˙γ a
ally −dp/dz is approximated by P /L, where P is the ˙ γ w = 3 + . (16)
pressure drop across the whole capillary including the en- 4 d ln τ R
trance and L is the capillary length. For a Newtonian fluid Hence, by plotting τ R versus ˙γ a on a ln–ln plot one obtains
the pressure gradient is nearly constant over the length of the reciprocal of the required correction factor. It turns out
the capillary. The pressure gradient is nonlinear for poly- that this value is just 1/n, where n is the power-law index.