
Page 114 - Academic Press Encyclopedia of Physical Science and Technology 3rd Polymer
P. 114
P1: FMX/LSU P2: GPB/GRD P3: GLQ Final pages
Encyclopedia of Physical Science and Technology EN012c-593 July 26, 2001 15:56
620 Polymer Processing
molecules there is some evidence that the following rela- where R is the gas law constant, T 0 is the reference tem-
tions hold: perature, and E is the flow activation energy. Typical
values of E /R for low-density polyethylene (LDPE),
¯ 13.0
¯ 6.8
η 0 ∝ M (M > M c ) 1,0 ∝ M . (23)
w w high-density polyethylene (HDPE), and polypropylene
3
3
3
In addition to the dependence of the magnitude of η 0 and (PP) are 4.5 × 10 K, 2.83 × 10 K, and 5.14 × 10 K,
1,0 on M w , the onset of shear-thinning behavior is af- respectively. The flow curves shown in Fig. 4 for LDPE
fected by M. As M increases, the onset of shear thinning measured at various temperatures have the same shape.
moves to lower shear rates. An increase in the breadth of Because of this they can be reduced to a single mas-
the molar mass distribution will also cause shear thinning ter curve plotting the viscosity in reduced form (i.e., η r
to occur at lower shear rates. versus ˙γ r ) where ˙γ r = a T ˙γ and η r = η/a T and where a T
The melt flow index (MI) is commonly used in the poly- is called the shift factor and is basically η 0 (T )/η 0 (T 0 ).
olefin industry to distinguish between polymers of differ- This shifting of viscosity to a master curve is reflective
ent molar mass. A schematic of an MI device is shown in of the principle of time–temperature superposition. This
Fig. 13. A known weight is applied to a plunger, which principle is based on the concept that at elevated temper-
pushes polymer melt through a capillary of specified di- atures the relaxation processes associated with changes
mensions (American Society for Testing of Materials, in chain conformation are much faster and hence the
ASTM, specifications). The mass of polymer leaving the molecule can respond to higher deformation rates. At
capillary over a 10-min period is collected and weighed. low temperatures the relaxation processes are retarded
Hence, 1.0 MI polymer means that 1 g of polymer was col- and the molecule can respond to only low deformation
lected in 10 min. The higher the MI, the lower the molar rates.
mass.
III. THERMAL PHYSICAL PROPERTIES
G. Effect of Temperature
The thermal material properties that are pertinent to the
The viscosity of homogeneous polymer melts is known to
processing of polymers are the density ρ, the constant
depend on temperature in a well-defined manner given by
the following expression: pressure heat capacity C p , (note: when ρ is constant
C p ≈ C v , the constant volume heat capacity), and the ther-
E 1 1 mal conductivity k. Representative thermal properties for
η(T ) = η(T 0 ) exp − , (24)
R T T 0 an amorphous polymer, in this case polycarbonate, are
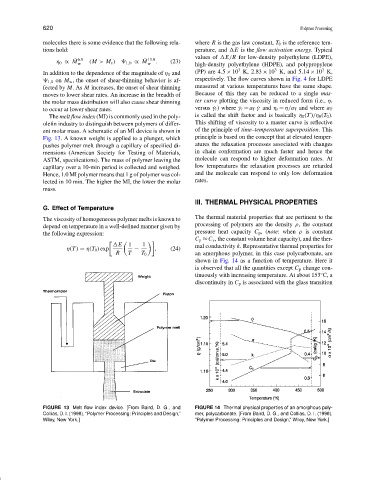
shown in Fig. 14 as a function of temperature. Here it
is observed that all the quantities except C p change con-
◦
tinuously with increasing temperature. At about 153 C, a
discontinuity in C p is associated with the glass transition
FIGURE 13 Melt flow index device. [From Baird, D. G., and FIGURE 14 Thermal physical properties of an amorphous poly-
Collias, D. I. (1998). “Polymer Processing: Principles and Design,” mer, polycarbonate. [From Baird, D. G., and Collias, D. I. (1998).
Wiley, New York.] “Polymer Processing: Principles and Design,” Wiley, New York.]