
Page 179 - Engineered Interfaces in Fiber Reinforced Composites
P. 179
Chapter 4. Micromechanics of stress transfer 161
where p(N)(< po), which is smaller than the original value, is now a function of the
clapscd cycles, and omax is smaller than the instantaneous debond stress, oz, in both
fiber pull-out and push-out. Gi, is a material constant that is identical to that defined
for monotonic loading. For the convenience of analysis, the following degradation
function for p(N) is employed for the two loading geometry
(4.155)
p, is the steady state or final value of the coefficient of friction, and Nl is the
corresponding maximum number of cycles after which there is no further
degradation in p. n is a power law exponent and is positive. Other functions such
as an exponential function or a reciprocal function can be used in place of the power
law as far as they eliminate the boundary condition of p(N) = p, for the number of
cycles greater than NI . However, any realistic friction degradation function should
always be consistent with independent experimental measurements.
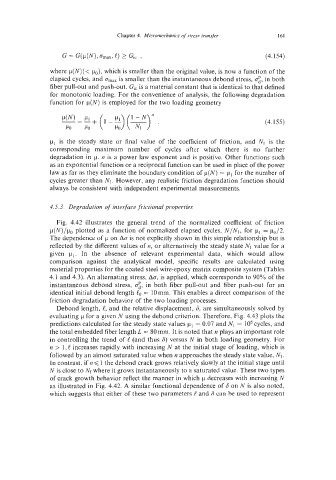
4.5.3. Degradation of interface frictional properties
Fig. 4.42 illustrates the general trend of the normalized coefficient of friction
p(N)/po plotted as a function of normalized elapsed cycles, N/NI, for pI = p0/2.
The dependence of p on ACJ is not explicitly shown in this simple relationship but is
reflected by the different values of n, or alternatively the steady state N1 value for a
given pl. In the absence of relevant experimental data, which would allow
comparison against the analytical model, specific results are calculated using
material properties for the coated steel wire-epoxy matrix composite system (Tables
4.1 and 4.3). An alternating stress, Ao, is applied, which corresponds to 90% of the
instantaneous debond stress, o:, in both fiber pull-out and fiber push-out for an
identical initial debond length lo = 1Omm. This enables a direct comparison of the
friction degradation behavior of the two loading processes.
Debond length, e, and the relative displacement, 6, are simultaneously solved by
evaluating p for a given N using the debond criterion. Therefore, Fig. 4.43 plots the
predictions calculated for the steady state values p1 = 0.07 and N1 = lo6 cycles, and
the total embedded fiber length L = 80mm. It is noted that n plays an important role
in controlling the trend of (and thus 6) versus N in both loading geometry. For
n > 1,e increases rapidly with increasing N at the initial stage of loading, which is
followed by an almost saturated value when n approaches the steady state value, NI .
In contrast, if n < 1 the debond crack grows relatively slowly at the initial stage until
N is close to Nf where it grows instantaneously to a saturated value. These two types
of crack growth behavior reflect the manner in which p decreases with increasing N
as illustrated in Fig. 4.42. A similar functional dependence of 6 on N is also noted,
which suggests that either of these two parameters P and 8 can be used to represent