
Page 356 - Engineering Electromagnetics, 8th Edition
P. 356
338 ENGINEERING ELECTROMAGNETICS
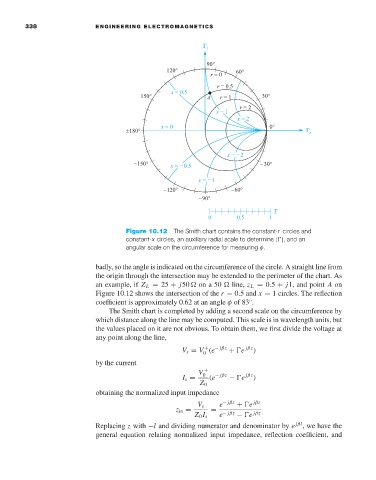
Figure 10.12 The Smith chart contains the constant-r circles and
constant-x circles, an auxiliary radial scale to determine | |, and an
angular scale on the circumference for measuring φ.
badly, so the angle is indicated on the circumference of the circle. A straight line from
the origin through the intersection may be extended to the perimeter of the chart. As
an example, if Z L = 25 + j50 ona50 line, z L = 0.5 + j1, and point A on
Figure 10.12 shows the intersection of the r = 0.5 and x = 1 circles. The reflection
coefficient is approximately 0.62 at an angle φ of 83 .
◦
The Smith chart is completed by adding a second scale on the circumference by
which distance along the line may be computed. This scale is in wavelength units, but
the values placed on it are not obvious. To obtain them, we first divide the voltage at
any point along the line,
V s = V (e − jβz + e jβz )
+
0
by the current
V 0 + − jβz jβz
I s = (e − e )
Z 0
obtaining the normalized input impedance
V s e − jβz + e jβz
z in = =
Z 0 I s e − jβz − e jβz
Replacing z with −l and dividing numerator and denominator by e jβl ,wehavethe
general equation relating normalized input impedance, reflection coefficient, and