
Page 359 - Engineering Electromagnetics, 8th Edition
P. 359
CHAPTER 10 Transmission Lines 341
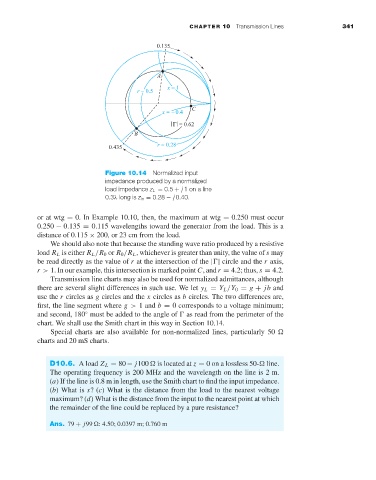
Figure 10.14 Normalized input
impedance produced by a normalized
load impedance z L = 0.5 + j 1ona line
0.3λ long is z in = 0.28 − j 0.40.
or at wtg = 0. In Example 10.10, then, the maximum at wtg = 0.250 must occur
0.250 − 0.135 = 0.115 wavelengths toward the generator from the load. This is a
distance of 0.115 × 200, or 23 cm from the load.
We should also note that because the standing wave ratio produced by a resistive
load R L is either R L /R 0 or R 0 /R L , whichever is greater than unity, the value of s may
be read directly as the value of r at the intersection of the | | circle and the r axis,
r > 1. In our example, this intersection is marked point C, and r = 4.2; thus, s = 4.2.
Transmission line charts may also be used for normalized admittances, although
there are several slight differences in such use. We let y L = Y L /Y 0 = g + jb and
use the r circles as g circles and the x circles as b circles. The two differences are,
first, the line segment where g > 1 and b = 0 corresponds to a voltage minimum;
and second, 180 must be added to the angle of as read from the perimeter of the
◦
chart. We shall use the Smith chart in this way in Section 10.14.
Special charts are also available for non-normalized lines, particularly 50
charts and 20 mS charts.
D10.6. A load Z L = 80− j100 is located at z = 0ona lossless 50- line.
The operating frequency is 200 MHz and the wavelength on the line is 2 m.
(a)If the line is 0.8 m in length, use the Smith chart to find the input impedance.
(b) What is s?(c) What is the distance from the load to the nearest voltage
maximum? (d) What is the distance from the input to the nearest point at which
the remainder of the line could be replaced by a pure resistance?
Ans. 79 + j99 : 4.50; 0.0397 m; 0.760 m