
Page 358 - Engineering Electromagnetics, 8th Edition
P. 358
340 ENGINEERING ELECTROMAGNETICS
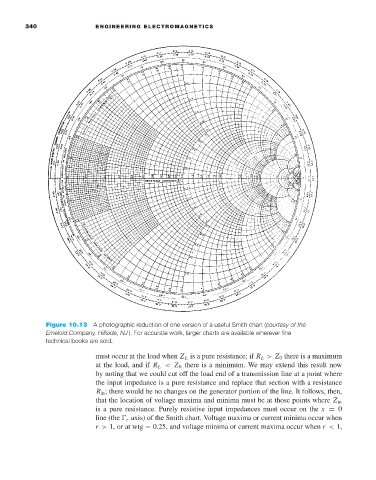
Figure 10.13 A photographic reduction of one version of a useful Smith chart (courtesy of the
Emeloid Company, Hillside, NJ ). For accurate work, larger charts are available wherever fine
technical books are sold.
must occur at the load when Z L is a pure resistance; if R L > Z 0 there is a maximum
at the load, and if R L < Z 0 there is a minimum. We may extend this result now
by noting that we could cut off the load end of a transmission line at a point where
the input impedance is a pure resistance and replace that section with a resistance
R in ; there would be no changes on the generator portion of the line. It follows, then,
that the location of voltage maxima and minima must be at those points where Z in
is a pure resistance. Purely resistive input impedances must occur on the x = 0
line (the r axis) of the Smith chart. Voltage maxima or current minima occur when
r > 1, or at wtg = 0.25, and voltage minima or current maxima occur when r < 1,