
Page 360 - Engineering Electromagnetics, 8th Edition
P. 360
342 ENGINEERING ELECTROMAGNETICS
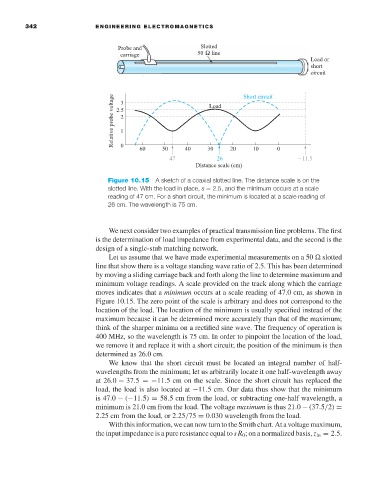
Figure 10.15 A sketch of a coaxial slotted line. The distance scale is on the
slotted line. With the load in place, s = 2.5, and the minimum occurs at a scale
reading of 47 cm. For a short circuit, the minimum is located at a scale reading of
26 cm. The wavelength is 75 cm.
We next consider two examples of practical transmission line problems. The first
is the determination of load impedance from experimental data, and the second is the
design of a single-stub matching network.
Let us assume that we have made experimental measurements on a 50 slotted
line that show there is a voltage standing wave ratio of 2.5. This has been determined
by moving a sliding carriage back and forth along the line to determine maximum and
minimum voltage readings. A scale provided on the track along which the carriage
moves indicates that a minimum occurs at a scale reading of 47.0 cm, as shown in
Figure 10.15. The zero point of the scale is arbitrary and does not correspond to the
location of the load. The location of the minimum is usually specified instead of the
maximum because it can be determined more accurately than that of the maximum;
think of the sharper minima on a rectified sine wave. The frequency of operation is
400 MHz, so the wavelength is 75 cm. In order to pinpoint the location of the load,
we remove it and replace it with a short circuit; the position of the minimum is then
determined as 26.0 cm.
We know that the short circuit must be located an integral number of half-
wavelengths from the minimum; let us arbitrarily locate it one half-wavelength away
at 26.0 − 37.5 =−11.5cmon the scale. Since the short circuit has replaced the
load, the load is also located at −11.5 cm. Our data thus show that the minimum
is 47.0 − (−11.5) = 58.5cm from the load, or subtracting one-half wavelength, a
minimum is 21.0 cm from the load. The voltage maximum is thus 21.0 − (37.5/2) =
2.25 cm from the load, or 2.25/75 = 0.030 wavelength from the load.
With this information, we can now turn to the Smith chart. At a voltage maximum,
the input impedance is a pure resistance equal to sR 0 ;ona normalized basis, z in = 2.5.